ॐ ह्रीं श्रीं लक्ष्मीभयो नमः॥


Trading "calls" from our "Software" with more than "90% accuracy"

More than "12 years" old "only site of whole world" 
with more than "9700 accurate Outlooks" of 
"Indian Stock Markets" 

Indian Stock Markets Closing Reports(07-Feb-2012)

Main features of today trading are as follows

1- Red closing of Benchmark Indices except BANKEX.
2- Engulfing Bearish Candle.
3- Selling at higher levels.

Ratios

Nifty Put Call Ratio:1.19
Nifty P/E Ratio(07-Feb-2012):19.02

Advances & Declines

BSE Advances : 1235
BSE Declines : 1650
NSE Advances : 522
NSE Declines : 934

Nifty Open Interest Changed Today

Nifty- 5200 CE(Feb)- +49500(+1.57%)
Nifty- 5200 PE(Feb)- +378100(+5.25%)

Nifty- 5300 CE(Feb)- -280500(-6.22%)
Nifty- 5300 PE(Feb)- +832800(+18.53%)

Nifty- 5400 CE(Feb)- +577050(+10.65%)
Nifty- 5400 PE(Feb)- +683450(+34.92%)

Closing 

Nifty- closed at 5,335.15(-26.50 Points & -0.49%)
Sensex- closed at 17,622.45(-84.86 Points & -0.48%)
CNX Midcap - closed at 7,355.15(-78.80 Points & -1.06%)
BSE Smallcap- closed at 6,073.11(-49.46 Points & -0.81%)

Nifty Spot-Levels & Trading Strategy for 08-02-2012

Nifty Spot-Levels

R3 5482
R2 5447
R1 5391
Avg 5356
S1 5300
S2 5265
S3 5209

Nifty Spot-Trading Strategy

H6 5426     Trgt 2
H5 5405     Trgt 1
H4 5385     Long breakout
H3 5360     Go Short
H2 5351
H1 5343
L1 5326
L2 5318
L3 5309     Long
L4 5284     Short Breakout
L5 5264     Trgt 1
L6 5243     Trgt 2

Nifty(Feb Fut)-Levels & Trading Strategy for 08-02-2012

Nifty(Feb Fut)-Levels

R3 5473
R2 5443
R1 5399
Avg 5369
S1 5325
S2 5295
S3 5251

Nifty(Feb Fut)-Trading Strategy

H6 5429     Trgt 2
H5 5412     Trgt 1
H4 5395     Long breakout
H3 5375     Go Short
H2 5368
H1 5361
L1 5348
L2 5341
L3 5334     Long
L4 5314     Short Breakout
L5 5297     Trgt 1
L6 5280     Trgt 2

Bank Nifty(Feb Fut)-Levels & Trading Strategy for 08-02-2012

Bank Nifty(Feb Fut)-Levels

R3 10643
R2 10544
R1 10437
Avg 10338
S1 10231
S2 10132
S3 10025

Bank Nifty(Feb Fut)-Trading Strategy

H6 10537     Trgt 2
H5 10490     Trgt 1
H4 10443     Long breakout
H3 10386     Go Short
H2 10367
H1 10348
L1 10311
L2 10292
L3 10273     Long
L4 10216     Short Breakout
L5 10169     Trgt 1
L6 10122     Trgt 2

Pre-Closing Outlook(07-02-2012)

Only Intraday volatility was expected and only it was seen whole day. Market is almost flat after minor higher levels selling signals. Selling between 5365-5389 was seen yesterday and Nifty slipped below it after more than 4 hours trading between this range as well as higher levels selling formations also today.

Very short term correction possibility is turning higher today

Mid-session Outlook(07-02-2012)

News based(GDP data and STT reduction news) based  volatile markets today after higher levels selling. Although sharp surge but whole up moves nullified within half hour.

Such volatilty for triggering of Stop Loss was perceived before opening of Indian markets therefore we covered our shorting positions at at par rates without waiting for SL triggering.

Mixed intraday positions therefore sustaining beyond 5330-5400 will be next moves confirmations and should be firstly watched.

NIFTY-Feb F&O-1st Shorting of 06-02-2012-Covering


NIFTY-Feb F&O-1st Shorting of 06-02-2012-Global markets mixed & STT Reduction news. Market will be volatile therefore cover immediately after opening(Lalit39)

very short term correction on 07-02-2012

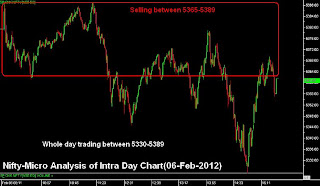
Nifty-Micro Analysis of Intra Day Chart For 07-02-2012

Nifty-Intra Day Chart(06-Feb-2012):-
Just click on chart for its enlarged view
Technical Patterns and Formations in today intraday charts

1- Selling between 5365-5389
2- Whole day trading between 5330-5389

Conclusions from intra day chart analysis 

Selling at higher levels today therefore very short term correction and slipping below today trading lows(5330) is expected and follow up buying/selling will decide the life and depth of correction tomorrow. As intraday selling at higher levels therefore consolidation and sustaining above 5389 is must for next up moves confirmations.

FII Trading Data in Derivatives Segment on 06-Feb-2012


FII & DII trading activity in Capital Market Segment on 06-Feb-2012

FII trading activity on NSE and BSE in Capital Julket Segment(In Rs. Crores)
CategoryDateBuy ValueSell ValueNet Value
FII06-Feb-20123512.462514.52997.94


DII trading activity on NSE and BSE in Capital Julket Segment(In Rs. Crores)
CategoryDateBuy ValueSell ValueNet Value
DII06-Feb-20121378.211561.33-183.12

Indian Stock Markets Closing Reports(06-Feb-2012)

Main features of today trading are as follows

1- All the Indices closed in Green except HC.
2- Hanging Man/Dragonfly Doji Bearish Candle formations
3- Intraday charts are suggesting selling at higher levels.

Ratios

Nifty Put Call Ratio:1.16
Nifty P/E Ratio(01-Feb-2012):19.13

Advances & Declines

BSE Advances : 1852
BSE Declines : 1064
NSE Advances : 974
NSE Declines : 486

Nifty Open Interest Changed Today

Nifty- 5200 CE(Feb)- -162450(-4.87%)
Nifty- 5200 PE(Feb)- +1324350(+21.74%)

Nifty- 5300 CE(Feb)- -58200(-1.19%)
Nifty- 5300 PE(Feb)- +1412500(+44.32%)

Nifty- 5400 CE(Feb)- +720800(+15.19%)
Nifty- 5400 PE(Feb)- +912100(+76.77%)

Closing 

Nifty- closed at 5,361.65(+35.80 Points & +0.67%)
Sensex- closed at 17,707.31(+102.35 Points & +0.58%)
CNX Midcap - closed at 7,433.95(+109.80 Points & +1.50%)
BSE Smallcap- closed at 6,781.93(+95.38 Points & +1.43%)

Nifty Spot-Levels & Trading Strategy for 07-02-2012

Nifty Spot-Levels

R3 5454
R2 5422
R1 5391
Avg 5359
S1 5328
S2 5296
S3 5265

Nifty Spot-Trading Strategy

H6 5424     Trgt 2
H5 5410     Trgt 1
H4 5395     Long breakout
H3 5378     Go Short
H2 5372
H1 5366
L1 5355
L2 5349
L3 5343     Long
L4 5326     Short Breakout
L5 5311     Trgt 1
L6 5297     Trgt 2

Nifty(Feb Fut)-Levels & Trading Strategy for 07-02-2012

Nifty(Feb Fut)-Levels

R3 5464
R2 5431
R1 5398
Avg 5365
S1 5332
S2 5299
S3 5266

Trading Strategy

H6 5432     Trgt 2
H5 5417     Trgt 1
H4 5402     Long breakout
H3 5384     Go Short
H2 5378
H1 5372
L1 5359
L2 5353
L3 5347     Long
L4 5329     Short Breakout
L5 5314     Trgt 1
L6 5299     Trgt 2

Bank Nifty(Feb Fut)-Levels & Trading Strategy for 07-02-2012

Bank Nifty(Feb Fut)-Levels

R3 10521
R2 10429
R1 10334
Avg 10242
S1 10147
S2 10055
S3 9960

Bank Nifty(Feb Fut)-Trading Strategy

H6 10427     Trgt 2
H5 10384     Trgt 1
H4 10341     Long breakout
H3 10290     Go Short
H2 10273
H1 10256
L1 10221
L2 10204
L3 10187     Long
L4 10136     Short Breakout
L5 10093     Trgt 1
L6 10050     Trgt 2

NIFTY-Feb F&O-1st Selling of 06-02-2012-Trade


NIFTY(feb Fut-Sell-Positional)SL-5396-TGT-5316-CMP-5374

NIFTY(Feb Put Option-Buy Positional)SL-5396-TGT-5316-S.P.FOR Put-5300,5400(feb Fut-Rates for all Options)-CMP-5374

Pre-Closing Outlook(03-02-2012)

Selling signals emerged at higher levels today therefore sustaining beyond today trading range will be next very short term confirmation 

Mid-session Outlook(03-02-2012)

Following guidance was given in Blasting Rally is on After all trends turning Up

minor intraday or very short term corrections may be seen any time after turning of heated sentiment

As sentiment was heated due to strong rally in US and European markets last Friday and Case against Chidaram was also dismissed therefore sentiment had been heated today morning and minor intraday correction is being seen and it may be a part of consolidation also.

Until complete selling pattern will not develop and Nifty will not sustain below 5250,till then short term correction will not be considered.

Blasting Rally is on After all trends turning Up

Technical Analysis,Research & Weekly Outlook
(Feb 06 to Feb 10,2012)

Technical Analysis and Research of EOD,weekly and Monthly charts,Micro Analysis of Nifty Intra Day Chart,Technical Positions,next possibilities have already been explained in following topics with 5 Charts therefore not being repeated. Just click following topic links and go through detailed analysis for trading in next week:-

1- 803 Nifty Points Strong Rally from 13th(Fibonacci number) Month
2- Bullish 'W' formations
3- Nifty-Micro Analysis of Intra Day Chart of 03-02-2012
4- Cross-Over of Crucial Resistances

Conclusions (After Putting All Studies Together)

Sparking breathless Bull rally is on and no one can say that where it will stop and correction will start despite overbought indicators. This fact should be kept in mind that indicators remain in overbought zone upto very much longer period during Bullish rallies. Although minor intraday or very short term corrections may be seen any time after turning of heated sentiment but market require complete selling patterns on daily charts for any short term or deeper correction. This fact should always be kept in mind that Bullish market completes correction in sideways moves also.

Bullish rally is very much continued and let it stop,divergence develop in indicators and distribution patterns form on EOD charts also then short term correction will be considered. As no such development seen yet therefore continuation of rally is expected in the coming week with this caution that whenever above mentioned correction patterns develop then only very short term and Short term correction should be considered.


803 Nifty Points Rally Predictions only by Us 

Today anyone can say for Bullish markets but who dared to imagine or tell for Bullish Rally in Dec 2011. When Most TV Channels,Websites and Experts were telling only for Bearish markets then We and only we started to predict for Bullish rally and result is 803 Nifty Ponts Rally.

Just Click follwing Topics Links and verify live Proofs on yours own:-

1- New historical highs in 2012 Predictions on 03-12-2011

Only  we  predicted  Bullish  Rally  first  of  all


Only Bullish Rally Predictions in all Weekly Outlooks

Bullish year(2012) Prediction on 22-12-2011

Bullish rally of 803 Nifty Points started on 20-12-2011 from 4532 but we immediately catched this rally and told following lines on 22-12-2011:-

"2012 will prove Bullish year after all corrections completion in 2011"

Just click following topic link and verify above statement on yours own as well as understand those technical points which emerged in Dec 2011 and gave birth to 803 Nifty Points rally in 2012:-

4693 is Long Term Trend Decider for 2012

Only we predicted Bullish Rally first of all

New historical highs in 2012 Predictions on 03-12-2011

When whole India was Bearish then following lines were told on 03-12-2011 by us and 803 Nifty Points rally  has already been seen.in last 33 sessions.

we are seeing high possibility of new historical highs in 2012 because Indian markets are reversing after completion of long term correction also.

Just click following topic link and verify above statement on yours own as well as understand technical reason of trend reversal in Dec 2011.

New Historical Highs in 2012