

| ||||||||||||||||
| ||||||||||||||||
Indian Stock Markets Closing Reports(18-Aug-2011)
Main features of today trading are as follows
1- Long Black Candle.
2- Red closing
3- All the Indices closed in Red except Reality.
Ratios
Nifty Put Call Ratio: 1.04
Nifty P/E Ratio(18-Aug-2011): 17.85
Advances & Declines
BSE ADVANCES : 604
BSE DECLINES : 2266
NSE ADVANCES : 220
NSE DECLINES : 1216
Nifty Open Interest Changed Today
Nifty- 4900 CE(Aug)- +1559850(+204.10%)
Nifty- 4900 PE(Aug)- +711850(+14.32%)
Nifty- 5000 CE(Aug)- +1252700(+36.01%)
Nifty- 5000 PE(Aug)- -829350(-11.95%)
Closing
Nifty- closed at 4,944.15(-112.45 Points & -2.22%)
Sensex- closed at 16,469.79(-371.01 Points & -2.20% )
CNX MIDCAP - closed at 7,188.80(-174.45 Points & -2.36%)
BSE SMALL CAP- closed at 7,148.19(-192.31 Points & -2.62%)
Nifty Spot-Levels & Trading Strategy for 19-08-2011
Nifty Spot-Levels
R3 5183
R2 5130
R1 5037
Avg 4984
S1 4891
S2 4838
S3 4745
Nifty Spot-Trading Strategy
H6 5090 Trgt 2
H5 5057 Trgt 1
H4 5024 Long breakout
H3 4984 Go Short
H2 4970
H1 4957
L1 4930
L2 4917
L3 4903 Long
L4 4863 Short Breakout
L5 4830 Trgt 1
L6 4797 Trgt 2
R3 5183
R2 5130
R1 5037
Avg 4984
S1 4891
S2 4838
S3 4745
Nifty Spot-Trading Strategy
H6 5090 Trgt 2
H5 5057 Trgt 1
H4 5024 Long breakout
H3 4984 Go Short
H2 4970
H1 4957
L1 4930
L2 4917
L3 4903 Long
L4 4863 Short Breakout
L5 4830 Trgt 1
L6 4797 Trgt 2
Nifty(Aug Fut)-Levels & Trading Strategy for 19-08-2011
Nifty(Aug Fut)-Levels
R3 5182
R2 5128
R1 5033
Avg 4979
S1 4884
S2 4830
S3 4735
Nifty(Aug Fut)-Trading Strategy
H6 5087 Trgt 2
H5 5053 Trgt 1
H4 5019 Long breakout
H3 4978 Go Short
H2 4965
H1 4951
L1 4924
L2 4910
L3 4897 Long
L4 4856 Short Breakout
L5 4822 Trgt 1
L6 4788 Trgt 2
R3 5182
R2 5128
R1 5033
Avg 4979
S1 4884
S2 4830
S3 4735
Nifty(Aug Fut)-Trading Strategy
H6 5087 Trgt 2
H5 5053 Trgt 1
H4 5019 Long breakout
H3 4978 Go Short
H2 4965
H1 4951
L1 4924
L2 4910
L3 4897 Long
L4 4856 Short Breakout
L5 4822 Trgt 1
L6 4788 Trgt 2
Bank Nifty(Aug Fut)-Levels & Trading Strategy for 19-08-2011
Bank Nifty(Aug Fut)-Levels
R3 10306
R2 10147
R1 9859
Avg 9700
S1 9412
S2 9253
S3 8965
Bank Nifty(Aug Fut)-Trading Strategy
H6 10019 Trgt 2
H5 9918 Trgt 1
H4 9816 Long breakout
H3 9693 Go Short
H2 9652
H1 9611
L1 9530
L2 9489
L3 9448 Long
L4 9325 Short Breakout
L5 9223 Trgt 1
L6 9122 Trgt 2
R3 10306
R2 10147
R1 9859
Avg 9700
S1 9412
S2 9253
S3 8965
Bank Nifty(Aug Fut)-Trading Strategy
H6 10019 Trgt 2
H5 9918 Trgt 1
H4 9816 Long breakout
H3 9693 Go Short
H2 9652
H1 9611
L1 9530
L2 9489
L3 9448 Long
L4 9325 Short Breakout
L5 9223 Trgt 1
L6 9122 Trgt 2
पूर्व बंद Outlook (18-08-2011)
कम्प्यूटरीकृत हिंदी अनुवाद
कमजोरी पहले ही स्पष्ट रूप से किया गया है पिछले outlooks में बताया और उम्मीद है कि अधिक नीचे जाता आने वाले सत्रों में देखा जाएगा क्योंकि इंट्रा दिन बेच पैटर्न आज.
Pre-closing Outlook(18-08-2011)
Weakness has already been clearly told in previous Outlooks and expected that more down moves will be seen in the coming sessions because intra day selling patterns today.
मध्य सत्र Outlook (18-08-2011)
मध्य सत्र Outlook (18-08-2011)
कम्प्यूटरीकृत हिंदी अनुवाद
Intraday चार्ट 5000 के नीचे बेच पैटर्न दिखा रहे हैं इसलिए अधिक नीचे जाता है की उम्मीद कर रहे हैं.
Mid-session Outlook(18-08-2011)
Intraday charts are showing selling patterns below 5000 therefore more down moves are expected.
पोस्ट - खुला आउटलुक 2 (18-08-2011)
कम्प्यूटरीकृत हिंदी अनुवाद
डॉव फ्यूचर्स तेजी से और अब इस क्षण में 100 से अधिक अंक नीचे फिसल. सभी एशियाई बाजारों में भी नीचे बढ़ रहे हैं और भारतीय बाजार तेजी से नीचे हैं. उच्च वैश्विक दबाव और निफ्टी 5018 के नीचे फिसल गया. अब भारतीय बाजार में अच्छी तरह से 5000 से नीचे चाल के अगले चरण के लिए तैयार हैं.
Post-open Outlook-2(18-08-2011)
Dow's Futures slipping sharply and now more than 100 points down at this moment. All the Asian markets are also moving down and Indian markets are fast down. High Global pressure and Nifty slipped below 5018. Now Indian markets are well prepared for next phase of down moves below 5000.
पोस्ट खुला आउटलुक (18-08-2011)
कम्प्यूटरीकृत हिंदी अनुवाद
हालांकि एशियाई बाजारों के अधिकांश लाल और डॉव फ्यूचर्स में भी 60 से अधिक अंक नीचे है, लेकिन भारतीय बाजार आज सकारात्मक खोला. यह भी देखा गया है कि भारतीय बाजार खोलने और 5045 के पास व्यापार के तुरंत बाद उच्च स्तर से फिसल. अच्छा समर्थन के रूप में 5018-5045 के बीच देखा कल इसलिए 5045 से परे सबसे पहले बनाए रखने अगली चाल के लिए पहला संकेत देखा जाएगा.
Post-open Outlook(18-08-2011)
Although most of the Asian markets are in Red and Dow's Futures is also more than 60 points down but Indian markets opened positive today. It has also been seen that Indian markets slipped from higher levels immediately after opening and trading near 5045. As good support seen between 5018-5045 yesterday therefore sustaining beyond 5045 will be firstly watched for next moves first indication.
प्री - ओपन बाजार आउटलुक (18-08-2011)
कम्प्यूटरीकृत हिंदी अनुवाद
EOD चार्ट, निफ्टी आंतर दिन चार्ट, तकनीकी पद के माइक्रो विश्लेषण तकनीकी विश्लेषण और अनुसंधान, अगले संभावनाओं को पहले से ही 2 इसलिए नहीं दोहराया जा रहा चार्ट के साथ निम्नलिखित विषयों में समझाया गया है: -
1 - 17 अगस्त 2011 को तीन तेजी पैटर्न
2 - 18-08-2011 के लिए निफ्टी माइक्रो आंतर दिन चार्ट के विश्लेषण
सभी एशियाई बाजारों में लाल और डॉव फ्यूचर्स में ट्रेडिंग भी आज अधिक से अधिक 50 अंक नीचे और भावना कमजोर इसलिए निफ्टी के बीच सबसे पहले या थोड़ा ऊपर कारोबार कमजोर उद्घाटन के बाद कल समर्थन रेंज (5018-5045) आज सुबह है. के रूप में समेकन निचले स्तर पर देखा गया था इसलिए ताजा बेच 5018 के नीचे की सूई के लिए जरूरी है. खरीदने और आज 5045 से ऊपर बनाए रखने का पालन करें अप चाल उम्मीद के पुनरुद्धार का मतलब होगा.
2011/05/08 पर खोलने और 5150-5225 के बीच अच्छा बेच के नीचे अंतराल के बाद निफ्टी 4946-5230 के बीच कारोबार कर रहा है. के रूप में समर्थन कल भी इसलिए 5018-5045 के बीच देखा इस श्रेणी आज सबसे पहले होना देखा जाएगा और इस सीमा से परे बनाए रखने निम्नलिखित निष्कर्ष देना होगा: -
1 - 5018 के नीचे कायम रखना गिरावट की तरह 2008 के गेट को खोलने के लिए मतलब होगा.
2 - 5045 से ऊपर कायम रखना चालें ऊपर के पुनरुद्धार का मतलब / बैक रैली उम्मीद खींचो.
बस घड़ी 5018-5045 अगली चाल पुष्टियों के लिए बाहर तोड़ने के लिए.
17 अगस्त 2011 को तीन तेजी पैटर्न
कम्प्यूटरीकृत हिंदी अनुवाद
18-08-2011 के लिए तकनीकी विश्लेषण अनुसंधान
निफ्टी - EOD चार्ट (17 Aug 2011): -
EOD चार्ट में तकनीकी पैटर्न और संरचनाओं
1 - गठन की तरह उल्टे हथौड़ा
2 - डबल नीचे संरचना.
3 - तेजी Harami सफेद मोमबत्ती.
4 - 5018-5045 के बीच अच्छा समेकन
5 - पूरे दिन intraday समेकन पैटर्न.
निष्कर्ष
भारतीय बाजारों में अन्ना हजारे आंदोलन 18-08-2011 और पूरे दिन intraday चार्ट भी समेकन संरचनाओं दिखा रहे हैं पर सबसे उदास भावना ट्रेडिंग दिन का नेतृत्व के दौरान स्पष्ट समर्थन मिला.
तीन तेजी पैटर्न और पूरे दिन intraday समेकन पैटर्न प्रवृत्ति उत्क्रमण संभावना का संकेत कर रहे हैं और अपनी पहली मजबूत संकेत 5120 के पार हो जाएगा.
अमेरिकी सूचकांक इस पल में 0.52% से 1.32% नीचे हैं और ग्लोबल भावना 18-08-2011 और भारतीय बाजारों पर भी नकारात्मक व्यापार हो सकता है उदास हो सकता है. इसलिए 5018-5045 के बीच अच्छे समेकन के रूप में जब तक निफ्टी 5018 नीचे कदम नीचे अगले तब तक नहीं बनाए रखा जाएगा जो भी नकारात्मक खबर प्रवाह और उदास भावनाओं के बावजूद नहीं माना जाएगा.
18-08-2011 के लिए तकनीकी विश्लेषण अनुसंधान
निफ्टी - EOD चार्ट (17 Aug 2011): -
 |
| बस अपने बढ़े हुए देखने के लिए चार्ट पर क्लिक करें |
1 - गठन की तरह उल्टे हथौड़ा
2 - डबल नीचे संरचना.
3 - तेजी Harami सफेद मोमबत्ती.
4 - 5018-5045 के बीच अच्छा समेकन
5 - पूरे दिन intraday समेकन पैटर्न.
निष्कर्ष
भारतीय बाजारों में अन्ना हजारे आंदोलन 18-08-2011 और पूरे दिन intraday चार्ट भी समेकन संरचनाओं दिखा रहे हैं पर सबसे उदास भावना ट्रेडिंग दिन का नेतृत्व के दौरान स्पष्ट समर्थन मिला.
तीन तेजी पैटर्न और पूरे दिन intraday समेकन पैटर्न प्रवृत्ति उत्क्रमण संभावना का संकेत कर रहे हैं और अपनी पहली मजबूत संकेत 5120 के पार हो जाएगा.
अमेरिकी सूचकांक इस पल में 0.52% से 1.32% नीचे हैं और ग्लोबल भावना 18-08-2011 और भारतीय बाजारों पर भी नकारात्मक व्यापार हो सकता है उदास हो सकता है. इसलिए 5018-5045 के बीच अच्छे समेकन के रूप में जब तक निफ्टी 5018 नीचे कदम नीचे अगले तब तक नहीं बनाए रखा जाएगा जो भी नकारात्मक खबर प्रवाह और उदास भावनाओं के बावजूद नहीं माना जाएगा.
Pre-Open Market Outlook(18-08-2011)
Technical Analysis and Research of EOD charts,Micro Analysis of Nifty Intra Day Chart,Technical Positions,next possibilities have already been explained in following topics with 2 Charts therefore not being repeated:-
1- Three Bullish Patterns on 17-Aug-2011
2- Nifty-Micro Analysis of Intra Day Chart For 18-08-2011
All the Asian markets are trading in Red and Dow Futures is also more than 50 points down today and sentiment is weak today morning therefore Nifty will firstly trade between or little above yesterday support range(5018-5045) after weak opening. As consolidation was seen at lower levels therefore fresh selling is must for dipping below 5018. Follow up buying and sustaining above 5045 today will also mean revival of up moves hopes.
Nifty is trading between 4946-5230 after gap down opening on 05-08-2011 and Good selling between 5150-5225. As Support also seen yesterday between 5018-5045 therefore this range will be firstly watched today and sustaining beyond this range will give following conclusions:-
1- Sustaining below 5018 will mean open the gate of 2008 like fall.
2- Sustaining above 5045 will mean revival of up moves/Pull Back rally hopes.
Just watch 5018-5045 break out for next moves confirmations.
Three Bullish Patterns on 17-Aug-2011
Technical Analysis and Research For 18-08-2011
Nifty-EOD Chart(17-Aug-2011):-
 |
| Just click on chart for its enlarged view |
1- Inverted Hammer like formation
2- Double Bottom Formation.
3- Bullish Harami white Candle.
4- Good consolidation between 5018-5045
5- Whole day intraday consolidation patterns.
Conclusions
Indian markets got clear support during Anna Hazare agitation led most depressed sentiment trading day on 18-08-2011 and whole day intraday charts are also showing consolidation formations.
Three Bullish patterns and whole day intraday consolidation patterns are signalling trend reversal possibility and its first strong indication will be crossing 5120.
US Indices are 0.52% to 1.32% down at this moment and Global sentiment may be depressed on 18-08-2011 and Indian markets may trade negative also. As good consolidation between 5018-5045 therefore until Nifty will not sustain below 5018 till then next down move will not be considered despite whatsoever negative news flow and depressed sentiments.

FII & DII trading activity in Capital Market Segment on 17-Aug-2011
| ||||||||||||||||
| ||||||||||||||||
18-08-2011 के लिए निफ्टी माइक्रो आंतर दिन चार्ट के विश्लेषण
कम्प्यूटरीकृत हिंदी अनुवाद
निफ्टी-अंतर दिन चार्ट (17 Aug 2011): -
आज intraday चार्ट में तकनीकी पैटर्न और संरचनाओं
1 - 5018-5045 के बीच समर्थन
2 - 5080-5110 के बीच प्रतिरोध
3 - 5018-5110 के बीच पूरे दिन के कारोबार
4 - वाष्पशील बाजार.
4 - Intraday पैटर्न समेकन संरचनाओं का सुझाव है.
निष्कर्ष
निचले स्तर पर और पूरे दिन intraday पैटर्न पर अच्छा समेकन समेकन संरचनाओं का सुझाव दे रहे हैं इसलिए अनुवर्ती कल खरीदने अन्ना हजारे आंदोलन के बावजूद स्थानांतरित संभावना मतलब होगा. आज की ट्रेडिंग रेंज बाहर तोड़ अगली चाल पहला संकेत हो सकता है और सबसे पहले कल देखा जाएगा.
निफ्टी-अंतर दिन चार्ट (17 Aug 2011): -
 |
| बस अपने बढ़े हुए देखने के लिए चार्ट पर क्लिक करें |
1 - 5018-5045 के बीच समर्थन
2 - 5080-5110 के बीच प्रतिरोध
3 - 5018-5110 के बीच पूरे दिन के कारोबार
4 - वाष्पशील बाजार.
4 - Intraday पैटर्न समेकन संरचनाओं का सुझाव है.
निष्कर्ष
निचले स्तर पर और पूरे दिन intraday पैटर्न पर अच्छा समेकन समेकन संरचनाओं का सुझाव दे रहे हैं इसलिए अनुवर्ती कल खरीदने अन्ना हजारे आंदोलन के बावजूद स्थानांतरित संभावना मतलब होगा. आज की ट्रेडिंग रेंज बाहर तोड़ अगली चाल पहला संकेत हो सकता है और सबसे पहले कल देखा जाएगा.
Nifty-Micro Analysis of Intra Day Chart For 18-08-2011
Nifty-Intra Day Chart(17-Aug-2011):-
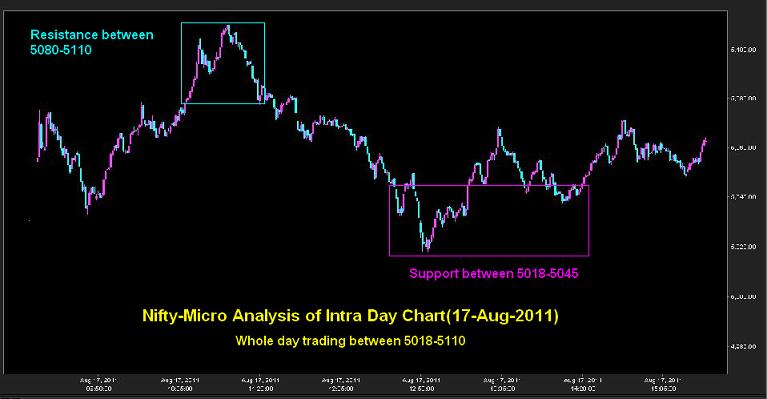 |
| Just click on chart for its enlarged view |
1- Support between 5018-5045
2- Resistance between 5080-5110
3- Whole day trading between 5018-5110
4- Volatile Market.
4- Intraday pattern is suggesting consolidation formations.
Conclusions
Good consolidation at lower levels and whole day intraday patterns are suggesting consolidation formations therefore follow up buying tomorrow will mean up move possibility despite Anna Hazare agitation. Today trading range break out will be next move first indication and will be firstly watched tomorrow.
Subscribe to:
Posts (Atom)