
ॐ ह्रीं श्रीं लक्ष्मीभयो नमः॥

Mid-Session Outlook(24-11-2010)
Market recovered nicely but sellling at higher levels developed after confirmation of Congress big defeat in Bihar elections. 5960-5975 intraday resistance.
NIFTY-DEC F&O-1ST BUYING TRADE OF 24-11-2010-COVERING
NIFTY DEC F & O(BOUGHT TODAY)-SELLING SEEN AT HIGHER LEVEL AFTER CONGRESS DEFEAT IN BIHAR ELECTIONS THEREFORE COVER IMMEDIATELY-CMP-5984
NIFTY-DEC F&O-1ST BUYING TRADE OF 24-11-2010-TRADE
NIFTY(DEC FUT-BUY-POSITIONAL)SL-5969-TGT-6064CMP-5994
NIFTY(DEC CALL OPTION-BUY-POSITIONAL)-S.P.FOR CALL-6000,6100-NIFTY(DEC FUT)-RATES ARE FOR SL-5969-TGT-6064 FOR ALL OPTIONS-CMP-5994
NIFTY(DEC CALL OPTION-BUY-POSITIONAL)-S.P.FOR CALL-6000,6100-NIFTY(DEC FUT)-RATES ARE FOR SL-5969-TGT-6064 FOR ALL OPTIONS-CMP-5994
5932 will Decide Match
Pre-Open Market Outlook(24-11-2010)
Long term trend is up,Short term trend is down and Intermediate term trend is sideways.
Wave 3 started from 3919 on 13-07-2009 and could not test its minimum target(6359). Nifty retraced after travelling 2440 points as well as shortened by 20 points to test its minimum target. On going leg started on 31-08-2010 from 5349 and short term correction started from 6339 after gaining 990 points. Short term correction started after good selling formations at higher levels in daily and intraday charts therefore good consolidations required at lower levels
5932 had been strong support and again prooved its strength in last 4 sessions through Nifty not sustaing below it despite 3 times breaking it down. Following 3 formations have also been developed therefore correction completion near 5932 will be considered if Nifty does not sustain below 5932:-
1- Falling channel formation in last 5 sessions intraday charts and it is bullish pattern.
2- Expanding triangle formations in daily charts. It is continuation pattern and showing on going uptrend continuation.
3- Short term indicators are oversold and signalling very short term upmove.
4- Yesterday candle is bullish hammer.
5- Supports at lower levels in last 4 sessions.
1- Falling Channel IN Last 5 Days Intraday Chart-
 2- Expanding Triangle Formation chart-
 As patterns emergrd therefore explained with this conclusion that 5932 should be watched and if Nifty sustains below it then be bearish for fresh down moves toward 200 Day EMA and if Nifty could not sustain below then crossing 6015 will be correction completion confirmation and first of all maket will be understood range bound within 5900-6330.
Dow is trading more than 150 points down therefore weaker Asian markets expected today morning and Nifty sustaining below or above 5932 should be watched for next move confirmations in the coming couple of sessions. My view is turning bullish after watching mentioned consolidation foemations. Today opening,and closing may be weak but intraday patterns showing consolidations despite weakness will turn view bullish for fresh upmoves.
Long term trend is up,Short term trend is down and Intermediate term trend is sideways.
Wave 3 started from 3919 on 13-07-2009 and could not test its minimum target(6359). Nifty retraced after travelling 2440 points as well as shortened by 20 points to test its minimum target. On going leg started on 31-08-2010 from 5349 and short term correction started from 6339 after gaining 990 points. Short term correction started after good selling formations at higher levels in daily and intraday charts therefore good consolidations required at lower levels
5932 had been strong support and again prooved its strength in last 4 sessions through Nifty not sustaing below it despite 3 times breaking it down. Following 3 formations have also been developed therefore correction completion near 5932 will be considered if Nifty does not sustain below 5932:-
1- Falling channel formation in last 5 sessions intraday charts and it is bullish pattern.
2- Expanding triangle formations in daily charts. It is continuation pattern and showing on going uptrend continuation.
3- Short term indicators are oversold and signalling very short term upmove.
4- Yesterday candle is bullish hammer.
5- Supports at lower levels in last 4 sessions.
1- Falling Channel IN Last 5 Days Intraday Chart-


Dow is trading more than 150 points down therefore weaker Asian markets expected today morning and Nifty sustaining below or above 5932 should be watched for next move confirmations in the coming couple of sessions. My view is turning bullish after watching mentioned consolidation foemations. Today opening,and closing may be weak but intraday patterns showing consolidations despite weakness will turn view bullish for fresh upmoves.
Falling wedge Formations in Last 5 days intraday charts
Bullish hammer Candle in daily chart today and Falling wedge Formations in 5 days intraday charts. Both are good consolidation formations in daily and intraday charts. Just watch 5932 and sustaining above 6015. If Nifty sustains above 6015 in the coming sessions then that will be strong confirmation of correction completion.


Pre-Closing Outlook(23-11-2010)
Sentiment dampened due to Korean war news therefore intraday support at lower levels seen. As per my view there will be no impact on world from any type of Korean war. As sentiments are formed from news channels therefore people reacts and trade accordingly on such type of non-significant news.
Voltality is character of selling markets and that is being seen As well as technical positions reverses in today like huge voltality also. It will be better to watch 5932 for intermediate term trend confirmation and sustainability beyond 5975-6015 should be used for 100% confirmation of next moves.
Voltality is character of selling markets and that is being seen As well as technical positions reverses in today like huge voltality also. It will be better to watch 5932 for intermediate term trend confirmation and sustainability beyond 5975-6015 should be used for 100% confirmation of next moves.
U-Turn of Subramanian Swamy fuelled rally Yesterday
Pre-Open Market Outlook(23-11-2010)
U-Turn of Subramanian Swamy fuelled rally in Indian markets yesterday.
Janata Party President Subramanian Swamy, who is the chief petitioner in the 2G Spectrum case, on Monday told the Supreme Court that there was no malafide on the part of the Prime Minister, Dr Manmohan Singh
In an affidavit filed yesterday, Swamy said: "There was no malafide on the part of the Prime Minister. The Prime Minister was badly advised by law officers, the Law Ministry and bureaucrats."
Earlier yesterday, before filing his affidavit, Swamy said the Prime Minister was sabotaged by his bureaucrats, as the files just kept moving from one department to another.
Swamy had on November 18 said that the Prime Minister should stop acting helpless and take stringent actions against those responsible for the scam.
Last 2 sessions Indian markets moves dedicated to Subramanian Swamy in following manner;-
Swami November 18 statement created PM resignation fear and that led sharp declines on November 19 but as soon as above U Turn news of Subramanian Swamy'stand came out then fear of Prime Minister'resignation wiped out and Rally seen in Indian markets om November 22. Nifty tested top of 1st resistance and closed near it at 6010.00.
Yesterday intraday chart of Nifty from 02:10-03:30 pm wthin 5975-6020 is showing Rising Wedge(bearish) formations and it may pose resistance in the coming sessions. As this bearish formation seen within resistance range(5950-6015) therefore this resistance strengthened. Complete consolidations requires to cross 6015. I told many times yesterday and again repeating today:-
"Watch sustaning above 6015 for upmove confirmations"
Intraday Chart of 22-11-2010-

Nifty traded within 5910-6015 yesterday with buying at lower levels and selling at higher levels yesterday. Nifty will trade within yesterday range(5910-6015) today and coming couple of sessions intraday charts will decide break out or break down.
As good selling patterns at higher levels therefore down moves were seen and breaking down possibility of 5932 can not be ruled out. On the other hand 5932 gave strong support 4 times earlier therefore must be watched and until Nifty does not sustain below it till then its breaking down will not get confirmations.
Firstly trading within 5910-6015 will be seen after weak opening today and interpretations of mentioned range break out are as follows:-
1- Breaking out of 6015 will mean correction completion and market moving into range bound(5900-6339) mode.
2- Breaking down of 5910 will mean deeper correction and testing possibility of 200 Day EMA(today at 5515)
Whole day trading within 5910-6015 expected and finally Red closing expected today. Sustaing below 5975 will validate yesterday Rising Wedge and will give strong indication of break down of 5910.
(Lalit Kumar Dhingra)
Pre-Closing Outlook(22-11-2010)
Nifty trading near 6015 and sustaing above will strong indication of correction completion. As SC will give comments on PMO Affadavit tomorrow therefore will be better to wait upto tomorrow and clearing of clouds. SC demanded explanation on CWC chairman appointment issue therefore opposition got another weapon to attack Govt. It will be better to wait upto tomorrow and let things settle down.
Post-Open Outlook(22-11-2010)
It will be decided within next 2 days that How much 2G Spectrum scam will lay impact on PM. SC will give his views tomorrow on PM Affidavit which was filed last Saturday. If any serious comment on PMO comes out then that may lead to PM resignation and only in that situation sharp declines will be seen in Indian markets otherwise Indian markets will move on its own technicals and no impact will be seen. Huge voltality possibility can not be denied in politically uncertain atmosphere.
Positive opening today because US futures trading 50 points up since morning today and scam impact on PM lessened today. Market positive today and:-
1- Correction completion level is sustaining above 6015
2- Correction continuation and more deeper down confirmation level is sustaining below 5932.
Positive opening today because US futures trading 50 points up since morning today and scam impact on PM lessened today. Market positive today and:-
1- Correction completion level is sustaining above 6015
2- Correction continuation and more deeper down confirmation level is sustaining below 5932.
NIFTY-NOV F&O-1ST SHORTING TRADE OF 19-11-2010-COVERING
NIFTY NOV F & O(SHORTED ON 19-11-2010)-COVER IMMEDIATELY,MARKET WILL BE HIGHLY VOLATILE DUE TO 2G SPECTRUM SCAM & WE SHALL SHORT AGAIN BUT FIRST COVER-CMP-5933
Pre-Open Market Outlook(22-11-2010)
US futures trading 50 points up but Asian markets are mixed today morning. Indian markets will react on 2G Spectrum issue in the coming couple of sessions and will be volatile also. It will also be decided in the coming couple of sessions that last Friday 5932 broken down was due to PM resignation rumour or genuine breaking down.
Settling down of 2G Spectrum issue and sustainability beyond 5932 will decide next Indian markets. All the levels and trend deciding factors have already been discussed in weekly.
Settling down of 2G Spectrum issue and sustainability beyond 5932 will decide next Indian markets. All the levels and trend deciding factors have already been discussed in weekly.
Intermediate Term Correction of 990 Points Rally
Weekly Analysis- 22-11-2010 to 26-11-2010
Following lines were told in the last conclusive paragraph of last week weekly:-
"Only minor pull back rally possibility in the begining of week otherewise finally testing 5932 and breaking down of 5932 as well as intermediate term trend turning downward possibility is high in the coming week"
Nifty broken down 5932 "by force" last Friday and it will be clear from following break out moves timings:-
"Nifty was trading '5970 at 02:25 pm and slipped to 5864 at 03:12 pm'. Nifty 'lost 106 points in 47 mintes in which 65 points down was in 14 only minutes'" Nifty not only broke 5932 by force but also 'closed 42 points below it at 5890'.
On going up move started on 31-08-2010 from 5349 which terminated on Muhurat trading day at 6339 after gaining 990 points. Nifty traded 42 sessions within 5932-6339 and got 3 times support near 5932 within this move. 42 sessions upmove neutralised last Friday after following distribution patterns:-
1- Rounding Top Formation
2- Intraday Charts selling patterns.
3- Down move in Falling channel.
4- All rising trend lines broken down
1-Technical Position Daily Chart-

Four Supports Broken in a day by Force on Closing Basis on 19-11-2010 and Nifty closed 69 down from form previous 42 sessions lowest closing:-
2-Nifty Line Chart-

Supports Ranges:-
Next Supports Ranges of 990 Points Rally(5349-6339) are as follows:-
1- 5835-5865
2- 5780-5805
3- 5580-5640
4- 5475-5500
5- 5420-5445
6- 5350-5370
3 Next Supports Ranges Chart-

Resistances Ranges:-
Good selling started from Muhurat session and daily selling seen. Following resistance Ranges shown in Last 10 Days intraday charts;-
1- 5950-6015
2- 6080-6120
3- 6180-6195
4- 6250-6320
4-Resistances in intraday Chart-

Fibonacci Retracement Levels:-
Rally terminated at 6339 and will correct whole rally which started from 5349 on 31-08-2010. On going 990 points rally will correct according to following Fibonacci Retracement Levels:-
13.0%- 6210
23.6%- 6105
27.0%- 6071
38.2%- 5960
50.0%- 5844
61.8%- 5727
70.7%- 5639
76.4%- 5582
78.6%- 5560
88.6%- 5461
5-Fibonacci Retracement Levels Chart-

Weekly Indicators and Averages Analysis:-
Almost "Marubozu Candle" formation in last week after "Engulfing Bearish" Candle in the previous week. 2nd Long Red weekly candle clearly confirming weakness.
1-Weekly Averages- Short term Weekly averages are above longer term averages.5-week,21-week EMA are flat while ,34-week,55-week EMA heading toward upward direction. Nifty moved below 5-week EMA and confirming weakness.
2-Weekly Bollinger Band- Complete 7 weeks distribution pattern near the upper band and slipping toward Middle Band confirming weakness and more down moves possibilities also.
3-Weekly MACD- MACD line is marginally above Average line in positive zone and MACD line is sliding also. MACD has not downward intersected Average line and divergence is only 6.431 as well as both lines are in kissing positions therefore MACD has to be watched because it will give next big move confirmations. MACD downward intersection of Average line will mean big down move confirmation and moving up without intersection will be up move confirmation after completion of correction.
4-Weekly ROC- Sliding in positive zone and little above equilibrium line therefore showing weakness signals.
5-Weekly RSI- Sliding in positive zone and little above equilibrium line therefore showing weakness signals.
6-Weekly Slow Stochastic- Both lines are at equilibrium line after slipping from overbought zone therefore showing weakness. As it is used to test oversold zone after slipping from overbought area therefore showing some more down moves possibility.
7-Weekly William %R- Moving down above equilibrium line after slipping from overbought zone therefore showing weakness. As it is used to test oversold zone after slipping from overbought area therefore showing some more down moves possibility.
6- weekly Indicators and Averages chart-

Daily Indicators and Averages Analysis:-
1-Averages- Nifty is above 55-Day,200-Day EMA and below 8-Day,21-Day EMA. 8-Day intersected downward 21-Day EMA. Nifty tested 55-Day EMA and closed below it last Friday and sutainability above or below 55-Day EMA will give next good move confirmations.
2-Bollinger Band- is at lower band after forming complete selling patterns at upper band. As at lower band therefore indicating minor up moves possibilities.
3- MACD- Both lines are sliding ,MACD at equilibrium line while Average line is above equilibrium line. Divergence increased in both lines therefore indicating small upmoves.
4-ROC- Entered into oversold zone therefore indicating small up move possibility. As no divergence therefore no up move confirmation.
5-RSI- Sliding above oversold zone therefore indicating some more down move possibility.
6-Slow Stochastic- Both lines slipped into oversold zone therefore indicating very short term upmoves possibility.
7-William %R- Slipped into oversold zone therefore indicating very short term upmove possibility.
7- Daily Indicators and Averages chart-

Conclusions (After Putting All Studies Together):-
Two Intermediate term correction signals in last week:-
1- Indian markets retraced after complete sellng patterns at higher levels and closed below 55-Day EMA(5980).
2- Nifty closed below intermediate term bottom(5932)
Nifty sustaining below 5932 in coming week will be confirmaton of and intermediate term down trend and it has to be received because last session sharp decline may be result of PM resigning possibility rumours also and regarding it some reports were seen on Business Channels also.
As good selling patterns at higher levels in Indices and many pivotal stocks `therefore I was non stop telling for the possibility of breaking down of 5932 and it happened, Nifty sustaning below it will mean Internediate term correction confirmation. Then next possibilities will be:-
1- Down move from 3 weeks to 3 months from the begining of move.
2- 200 Day EMA testing possibility which is today at 5510.
Weekly indicators are confirming down move while daily indicators indicating small up moves because very short term indicators moved into oversold area which may be seen in the begining of week. If Nifty sustains below 5932 in the begining of week then it will be more down confirmation and Nifty sustaining above 1st resistance range(5950-6015) will be correction completion confirmation.
As good selling patterns at higher levels in Indices and many pivitas stocks therefore expected that Correction of 990 Points Rally will be seen according to above mentioned Fibonacci Retracement Levels. Also expected that Nifty will finally sustain below 5932 after fresh selling in the coming week and weekly closing will be Red. Complete consolidations requires for any up move and until that will not be seen till then upmoves will not be considered. At present sustaining above 6015 is upmove confirmation point.
6 Next Supports Ranges

6 Next Supports Ranges:-
1- 5835-5865
2- 5780-5805
3- 5580-5640
4- 5475-5500
5- 5420-5445
6- 5350-5370

4 Resistance Ranges in Last 10 Days
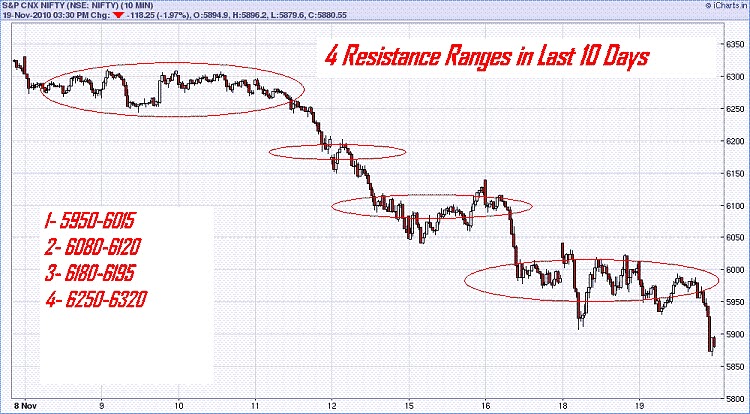
4 Resistance Ranges in Last 10 Days
1- 5950-6015
2- 6080-6120
3- 6180-6195
4- 6250-6320
NIFTY-NOV F&O-1ST SHORTING TRADE OF 19-11-2010-TRADE
NIFTY-SHORT-NOV FUTURE AND OPTIONS(PUT-BUY) AT MARKET RATE- SL AND TGT WILL BE GIVEN ON MONDAY-CMP-5898
Post-Open Outlook-2(19-11-2010)
All the Asian markets recovered and more than 2/3% sharp surge seen in Hangseng and China markets. Indian markets also recovered from lower levels but confirmations required from range break out(5932-6015).
It has also been observed from last 1 hour move that Indian markets underperformed Asian markets because less recovery in percentage terms seen in Indian markets. At present Indian market reacting Asian markets moves only and let more indications come then final conclusions will be drawn and next moves confirmation range is 5932-6015.
It has also been observed from last 1 hour move that Indian markets underperformed Asian markets because less recovery in percentage terms seen in Indian markets. At present Indian market reacting Asian markets moves only and let more indications come then final conclusions will be drawn and next moves confirmation range is 5932-6015.
Post-Open Outlook(19-11-2010)
All the Asian markets slipped from higher levels. Hangseng and China are more than 1% down therefore sentiment weakened and Indian markets down as well as trading at lower levels of yesterday last 4 hours range(5950-6015). Breaking below 5950 and sustaining below 5932 will be deeper correction confirmation.
Although upmoves were expected after warching consolidations within last 4 hours range yesterday but Asain markets led weakness is being seen in Indian markets today therefore mentioned levels should be watched for next down move confirmations also.
Although upmoves were expected after warching consolidations within last 4 hours range yesterday but Asain markets led weakness is being seen in Indian markets today therefore mentioned levels should be watched for next down move confirmations also.
Pre-Open Market Outlook-2(19-11-2010)
US and European markets closed with good gains yesterday but Asian markets are not responding those gains and trading mixed today therefore sentiment is quiet today morning. Flat opening and firstly trading within 6090-6150 expected in changed sentiments. Next immediate move confirmation range is yesterday last 4 hours range(5950-6015). As consolidation signals were seen within this range yesterday therefore up moves from this range expected and fresh selling patterns required today to break it down.
As Asian markets are mixed therefore 6090-6150 will be next move confirmation range and intraday patterns within this range will give next move confirmations today. As yesterday last 4 hours consolidation patterns therefore up moves expected at this moment.
As Asian markets are mixed therefore 6090-6150 will be next move confirmation range and intraday patterns within this range will give next move confirmations today. As yesterday last 4 hours consolidation patterns therefore up moves expected at this moment.
Pre-Open Market Outlook(19-11-2010)
Nifty tested strong support 5932 amid violent voltality and recovered as well as closed in Green yesterday. Nifty traded last 4 hours today within 5950-6015 yesterday and Nifty traded within 5975-6010 last tuesday. 8 hours trading range(5950-6015) is sufficient to give first strong indication to next moves therefore this range break out should be used for next move confirmations.
Last 8 hours trading range(5950-6015) is indicating consolidations and expected that Nifty will sustain above it today. 5932-6015 is now strong support range,Good selling patterns requires to break this range.
Nest resistance ranges are as follows:-
1- 6080-6120(Minor Resistance)
2- 6180-6195(Minor Resistance)
3- 6250-6320(Strong Resistance)
Indian markets moved into range bound mode and will first prepare within 6015-6250 for next moves. Break out and sustaining beyond 5932-6339 will give following next moves confirmations:-
1- Sustaing below 5932 will mean deeper correction
2- Sustaing above 6339 will mean completion of short term correction in range bound mode.
Positive opening and firstly trading wthin 6020-6080 expected.Green closing after whole day positive zone trading expected and sustaining above 6120 will give next good upmove confirmations.
Until Nifty does not sustain beyond mentioned ranges till then only range bound market should be expected trading targets should be within range.
Subscribe to:
Posts (Atom)