Watch levels one by one amid finally
down moves expectations
Technical Analysis,Research & Weekly Outlook
(May 13 to May 17,2024)
Nifty-Weekly Chart Analysis
(Waves structure)
Nifty-Weekly Chart (10-May-2024):-
Technical Patterns and Formations in EOD charts
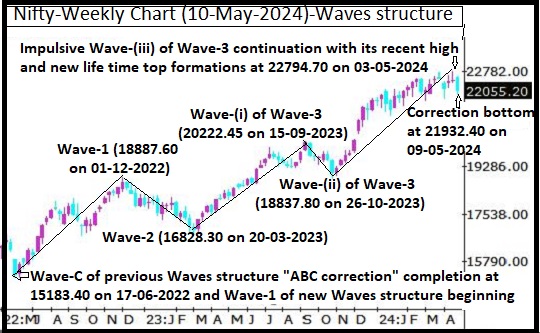
1- Corrective Wave-C of previous Waves structure "ABC correction" completion at 15183.40 on 17-06-2022 and Impulsive Wave-1 of new Waves structure beginning.
2- Impulsive Wave-1 completion at 18887.60 on 01-12-2022.
3- Corrective Wave-2 completion at 16828.30 on 20-03-2023.
4- Impulsive Wave-(i) of Wave-3 completion at 20222.45 on 15-09-2023
5- Corrective Wave-(ii) of Wave-3 completion at 18837.80 on 26-10-2023
6- Impulsive Wave-(iii) of Wave-3 continuation with its recent high and new life time top formations at 22794.70 on 03-05-2024.
7- Short Term correction continuation with its recent bottom formations at 21932.40 on 09-05-2024.
Conclusions from Weekly chart analysis
(Waves structure)
Corrective Wave-C of previous Waves structure completed at 15183.40 and Impulsive Wave-1 of new Waves structure started from this level. Now impulsive Wave-(iii) of Wave-3 of on going Waves structure is in continuation with its recent high and new life time top formations at 22794.70 on 03-05-2024 and no confirmation of its completion yet on Weekly charts. Short Term correction begun from this level which is in continuation with its recent bottom formations at 21932.40 on 09-05-2024 and no confirmation of its completion yet also on Weekly Charts. As in previous week long Weekly candle formations with closing near the lowest of previous week therefore emergence of more downward moves beginning signals will be understood and view has turned cautious.
Nifty-Weekly Chart Analysis
(Stochastic & MACD)
Nifty-Weekly Chart (10-May-2024):-
Technical Patterns and Formations in Weekly charts
1- Last 8 weeks(33 Sessions) trading from 20-03-2024 to 10-05-2024 and between 21711-22794 with 2 Short Term Corrections bottom formations at 21717.70 on 19-04-2024 and 21932.40 on 09-05-2024.
2- Previous week closing at the lowest of last 8 weeks(33 Sessions)
2- Stochastic- %K(5) line has intersected %D(3) line downward and its both lines are falling from Over bought zone.
3- Stochastic:- %K(5)- 53.43 & %D(3)- 57.29.
4- Stochastic is showing negative divergence.
5- In MACD- MACD line has intersected Average line downward and its both lines are falling in positive zone.
6- MACD(26,12)- 384.61 & EXP(9)- 767.49 & Divergence- -382.88.
7- MACD is showing negative divergence.
Conclusions from Weekly chart analysis
(Stochastic & MACD)
As short Term correction continuation with previous week closing at the lowest of last 8 weeks(33 Sessions) therefore it will be understood that on going correction continuation signals have been emerged. Technical positions of Intermediate Term indicators are as follows;-
1- As in Weekly Stochastic indicator its %K(5) line has intersected %D(3) line downward and its both lines are falling towards Over sold zone as well as this indicator is showing negative divergence also therefore decisive downward moves are expected in the coming week/weeks.
2- As in Weekly MACD indicator its MACD line has intersected Average line downward and its both lines are falling in positive zone as well as this indicator is showing negative divergence also therefore it will be understood that MACD is confirming Downward trend formations and resultant deeper correction beginning possibility also in the coming week/weeks.
Nifty-EOD Chart Analysis
(Stochastic & MACD)
Nifty-EOD Chart (10-May-2024):-
Technical Patterns and Formations in EOD charts
1- More than 3 months old Rising Channel Pattern formations
2- Nifty closed below lower rising line of Rising Channel Pattern for the last 2 sessions.
3- Stochastic- Both lines %K(5) and %D(3) are kissing in Over sold zone.
4- Stochastic:- %K(5)- 13.82 & %D(3)- 14.26.
5- In MACD- Both MACD line and Average line are kissing near about Zero Line
6- MACD(26,12)- -22.91 & EXP(9)- 23.53 & Divergence- -46.44
7- MACD is showing negative divergence
Conclusions from EOD chart analysis
(Stochastic & MACD)
More than 3 months old Rising Channel Pattern formations and last 2 sessions closing was below its lower rising line therefore now only first signal of decisive downward moves beginning will be understood. Technical positions of Short Term indicators are as follows:-
1- As in Stochastic indicator its both lines %K(5) and %D(3) are kissing in Over sold zone therefore it will be understood that at present this indicator is not showing any side decisive moves beginning signals.
3- As in MACD indicator its both MACD line and Average line are kissing near about Zero Line therefore it will be understood that now it is not showing clear signals any side Trend formation.
Let any side clear intersection happen in both Stochastic and MACD indicators then that side Short Term moves will be seen. As MACD is showing negative divergence also therefore higher possibility of decisive downward moves beginning will be understood after Downward trend formations in the coming week/weeks
Nifty-EOD Chart Analysis
(Averages)
Nifty-EOD Chart (10-May-2024):-
Technical Patterns and Formations in EOD charts
Averages:-
1- 5-Day SMA is today at 22212
2- 21-Day SMA is today at 22381
3- 55-Day SMA is today at 22284
4- 100-Day SMA is today at 21992
5- 200-Day SMA is today at 20846
Conclusions from EOD chart analysis
(Averages)
As Nifty has closed below Short Term Trend deciders(5-Day and 21-Day SMA) in last 4 sessions of previous week therefore Short Term Trend is at stake and Nifty has closed below Intermediate Term Trend decider(55-Day SMA) in the last 3 sessions of previous week therefore Intermediate Term Trend will also be understood at stake. Although Long Term trend is up but both other Trends are at stake. As Nifty is closing near about 100-Day SMA for the last 2 sessions therefore firstly sustaining it beyond should be watched in the coming week/weeks for next bigger moves beginning and next Trend formation confirmations
Nifty-Intra Day Chart Analysis
(10-May-2024)
Nifty-Intra Day Chart (10-May-2024):-
Technical Patterns formation in today intraday charts
1- 140 Points up moves after positive opening
2- Selling between 22062-22131
3- Down moves in Bullish Falling Channel
4- Consolidation between 22009-22037
3- Whole day actual trading between 21951-22131
Conclusions from intra day chart analysis
Although firstly 140 points up moves after positive opening but selling developed in first 2 hours therefore down moves started and Nifty slipped more than 100 points as well as traded below 22000. As these down moves were in Bullish Falling Channel which is a consolidation pattern and after that consolidation was seen in sideways trading range also therefore whole day last Friday trading will be understood with higher levels selling and lower levels consolidation.
As whole day mixed intraday trading Patterns formation between 21951-22131 last Friday therefore expected that Nifty will firstly trade and prepare for next decisive moves within and near about last Friday trading range in the beginning of next week. Finally sustaining beyond last Friday trading range will confirm next decisive moves beginning therefore it should be watched in the coming sessions for one sided next decisive moves beginning confirmations.
Conclusions
(After putting all studies together)
1- Long Term trend is up.
2- Intermediate Term trend at stake.
3- Short Term Trend is at stake.
Although now impulsive Wave-(iii) of Wave-3 continuation with its recent high and new life time top formations at 22794.70 and no confirmation of its completion yet but Short Term correction begun from this level which is in continuation with its recent bottom formations at 21932.40 on 09-05-2024 and no confirmation of its completion also yet.
As Intermediate Term indicators are showing clear signals of correction continuation therefore more down moves are expected but Short Term indicators not showing clear signals hence some up moves can not be ruled out. Finally down moves are expected and firstly following levels should be watched one by one in the coming week/weeks for next decisive moves beginning confirmations;-
1- 21951- Last Friday lowest because some intraday supports was seen above it that day.
2- 21992- 100-Day SMA because Nifty is closing near about it for the last 2 sessions and it will finally confirm the life of Short and Intermediate Term trends which are now at stake.
3- 21778- Bottom of previous Short Term correction
4- 21711- Bottom of Last 8 weeks(33 Sessions)
As correction continuation expectations therefore following next supports below previous session closing should be watched one by one in the coming week/weeks:-
1- 21886-22037
2- 21795-21860
3- 21711-21791
4- 21653-21690
5- 21544-21628
Resistances above previous session closing is as follows:-
1- 22062-22131
2- 22132-22183
3- 22281-22368
4- 22482-22536
5- 22674-22702
6- 22733-22783