ॐ ह्रीं श्रीं लक्ष्मीभयो नमः॥


Trading "calls" from our "Software" with more than "90% accuracy"

 This is the "Oldest & Only Website" of whole World
which is updating Nifty & Indian Stock Markets
"Daily and Weekly accurate Outlooks" 
with "Intraday Charts Analysis"for the 
last more than "14 years" means from "2010"
For its live Proofs just see "Archive"
in the "bottom of this Website".

Technical Analysis and Market Outlook(08-10-2013)

Nifty-Intra Day Chart (07-Oct-2013):-
Just click on chart for its enlarged view
Technical Patterns and Formations in today intraday charts

1- Support between 5826-5850
2- Strong recovery after lower levels support.
2- Whole day actual trading between 5826-5910

Conclusions from intra day chart analysis 

As following depressing news flow therefore most time negaive zone traing after fast slipping immediately after opening:-

1- US Futures were in deep Red whole day.
2- All Asian markets closed in Ted after most time negative zone trading and some closed sufficiently down.
3- All European traded in Deep Red after gap down opening during Indian markets trading hour.

Sentiment was completely depressed whole day but strong recovery from lower levels despite higher levels some selling last Friday because following positive news was in the pipe line which came out after closing of yesterday market:-


(Just click above topic link for detailed news)

As strength shown and strong recovery from lower levels amid most negative Global markets as well as good news yesterday therefore some up moves will be seen today. Next resistance is at 5950 and sustaining above it will mean high possibility of Wave-3 rally after completion of Wave-2 correction.

Nifty Spot-Levels & Trading Strategy for 08-10-2013

Nifty Spot-Levels

R3 6024
R2 5968
R1 5937
Avg 5881
S1 5850
S2 5794
S3 5763

Nifty Spot-Trading Strategy

H6 5994     Trgt 2
H5 5974     Trgt 1
H4 5953     Long breakout
H3 5929     Go Short
H2 5921
H1 5913
L1 5898
L2 5890
L3 5882     Long
L4 5858     Short Breakout
L5 5837     Trgt 1
L6 5817     Trgt 2

Nifty(Oct Fut)-Levels & Trading Strategy for 08-10-2013

Nifty(Oct Fut)-Levels

R3 6069
R2 6009
R1 5976
Avg 5916
S1 5883
S2 5823
S3 5790

Nifty(Oct Fut)-Trading Strategy

H6 6037     Trgt 2
H5 6015     Trgt 1
H4 5994     Long breakout
H3 5968     Go Short
H2 5960
H1 5951
L1 5934
L2 5925
L3 5917     Long
L4 5891     Short Breakout
L5 5870     Trgt 1
L6 5848     Trgt 2

Bank Nifty(Oct Fut)-Levels & Trading Strategy for 08-10-2013

Bank Nifty(Oct Fut)-Levels

R3 10567
R2 10397
R1 10269
Avg 10099
S1 9971
S2 9801

Bank Nifty(Oct Fut)-Trading Strategy

H6 10445     Trgt 2
H5 10375     Trgt 1
H4 10304     Long breakout
H3 10222     Go Short
H2 10195
H1 10168
L1 10113
L2 10086
L3 10059     Long
L4  9977     Short Breakout
L5  9906     Trgt 1
L6  9836     Trgt 2
As busy today therefore next Outlook will be updated tomorrow.
Wishing you very happy Navratri and Dussehra.May God give you huge wealth,good fame, great success.
Live Proofs of Profits,Perfect Timing and the Best Services of Indian Stock Markets to Our Paid Clients
When Indian markets were trading with good gains and Nifty was more than 130 Points on 03-10-2013 then we were expecting some down moves on 04-10-2013 therefore sent following SMS to paid clients at 03:24 PM:- 

NIFTY-Oct PE(5700)-Buy-Positional-SL-49 & TGT-124-CMP-69(Lalit 39)

When Indian markets were trading at the lowest of the day then we were expecting up moves therefore sent Profit Booking SMS to paid clients on 04-10-2013 at 11:31 AM:

NIFTY-Oct PE(5700)-Bought on 03-10-2013-Cover and book profit immediately-CMP-80(L alit39)

As we always talk with those proofs which no one can deny therefore updating following picture of above SMS sent to our paid clients:-

1st Website Picture:-
Just click on above picture for enlarged view of those SMS which were sent to paid clients
2nd Website Picture:-
Just click on above picture for enlarged view of those SMS which were sent to paid clients


Only 2 following information are deleted in above SMS Picture due to official secrecy rules:-

1- Numbers of sent SMS.
2- SMS sending Website name.
Long Term trend is at stake in Indian Stock Markets  
Technical Analysis,Research & Weekly Outlook
(Oct 07 to Oct 11,2013)

Nifty-EOD Chart (04-Oct-2013):-
Just click on chart for its enlarged view
Technical Patterns and Formations in EOD charts

1- Bottom formation at 5118.85 on 28-08-2013 and Wave-1 beginning
2- Wave-i(5580.95 on 03-09-2013) 
3- Wave-ii(5318.90 on 04-09-2013) 
4- Wave-iii(5957.25 on 16-09-2013) 
5- Wave-iv(5798.15 on 16-09-2013) 
6- Wave-v of Wave-1 completion at 6142.50 on 19-09-2013 
7- 'ABC' Correction continuation.
8- Wave-A(5811.10 on 25-09-2013)
9- Wave-B(5917.65 on 26-09-2013)
10- Wave-C of Wave-2 completion at 5700.95 on 01-10-2013.
11- Wave-3 continuation

Conclusions from EOD chart analysis 

Wave-3 beginning signals but its confirmation is required yet and that will mean new all time high formations. 

Nifty-EOD Chart (04-Oct-2013):-
Just click on chart for its enlarged view
Technical Patterns and Formations in EOD charts

1- Wave-1 beginning after bottom formation at 5118.85 on 28-08-2013
2- Wave-1 completion after its Wave-v completion at 6142.50 on 19-09-2013
3- Wave-2 correction beginning 

Conclusions from EOD chart analysis

Wave-2 correction beginning after Wave-v of Wave-1 completion therefore correction of whole Wave-1(5118-6142) seen according to following Fibonacci Retracement Levels(6142-5118):-  

23.6%- 5900(Retracement completed) 
38.2%- 5750(Retracement completed) 
50.0%- 5630
61.8%- 5509
76.4%- 5359

Good up moves in previous week after 38.2% retracement completion and strong signal of Wave-3 beginning.

Nifty-EOD Chart (04-Oct-2013):-
Just click on chart for its enlarged view
Technical Patterns and Formations in EOD charts

1-18 sessions sideways trading between 5701-6142
2-200 Day SMA(today at 5840)
3-200 Day EMA(today at 5755)

Conclusions from EOD chart analysis 

18 sessions sideways trading between 5701-6142 and vaalid break out will mean strong Long Term Moves because both Long Term Trend decider 200 Day SMA and 200 Day EMA are lying within this range.

Nifty-EOD Chart (04-Oct-2013):-
Just click on chart for its enlarged view
Technical Patterns and Formations in EOD charts

1- Bearish Head and Shoulders Pattern formation with Neckline at 5810  
2- Bullish Inverted Head and Shoulders Pattern formation with Neckline at 5946

Conclusions from EOD chart analysis

Both big moves decider Bearish and Bullish patterns formations in last 18 sessions sideways trading between 5701-6142.

Conclusions (After Putting All Indicators Together)

Emergence of Wave-3 formation signals in previous week and its confirmation will mean those up moves and higher level targets which can not be imagined at this moment. Let Wave-3 formation confirmation come then its targets will be updated. 

Certainly Long Term trend is at stake and its live proof is that Nifty is hovering around its decider 200 Day SMA and 200 Day EMA for the last 18 sessions as well as tested 10 times 200 Day SMA. Let market prepare for next trend then will be updated according to intraday charts formations,as being done continuously for the last more than 4 years in this Blog.

Last 18 sessions sideways trading between 5701-6142 with both Bearish and Bullish patterns formation and Bullish Inverted Head and Shoulders Pattern formation therefore Indian markets are not prepared for any side decisive moves and have to prepare firstly for one sided moves and next trend between 5701-6142. certainly valid break out of this range will be next Long Term trend confirmation because both Long Term Trend decider 200 Day SMA(today at 5840) and 200 Day EMA(today at 5755) are lying within this range.

Nifty Spot-Levels & Trading Strategy for 07-10-2013

Nifty Spot-Levels

R3 6008
R2 5979
R1 5943
Avg 5914
S1 5878
S2 5849
S3 5813

Nifty Spot-Trading Strategy

H6 5972     Trgt 2
H5 5957     Trgt 1
H4 5942     Long breakout
H3 5924     Go Short
H2 5918
H1 5912
L1 5901
L2 5895
L3 5889    Long
L4 5871     Short Breakout
L5 5856     Trgt 1
L6 5841     Trgt 2

Nifty(Oct Fut)-Levels & Trading Strategy for 07-10-2013

Nifty(Oct Fut)-Levels

R3 6078
R2 6043
R1 5996
Avg 5961
S1 5914
S2 5879
S3 5832

Nifty(Oct Fut)-Trading Strategy

H6 6032     Trgt 2
H5 6013     Trgt 1
H4 5995     Long breakout
H3 5972     Go Short
H2 5965
H1 5957
L1 5942
L2 5934
L3 5927     Long
L4 5904     Short Breakout
L5 5886     Trgt 1
L6 5867     Trgt 2

Bank Nifty(Oct Fut)-Levels & Trading Strategy for 07-10-2013

Bank Nifty(Oct Fut)-Levels

R3 10777
R2 10638
R1 10449
Avg 10310
S1 10121
S2 9982
S3 9793

Bank Nifty(Oct Fut)-Trading Strategy

H6 10591     Trgt 2
H5 10516     Trgt 1
H4 10441     Long breakout
H3 10351     Go Short
H2 10321
H1 10291
L1 10230
L2 10200
L3 10170     Long
L4 10080     Short Breakout
L5 10005     Trgt 1
L6  9930    Trgt 2

Pre-closing Outlook(04-10-2013)

Nifty is trading near the lower levels of the day at this moment but today intraday patterns are not showing as such selling patterns therefore next down move will be considered only after sustaining below today lowest and today trading range valid break out will be next trend confirmation.

Mid-session Outlook(04-10-2013)

All trends are up and higher levels selling today after Bearish Rising Channel formations yesterday but some intraday supports also seen at lower levels today. Certainly mixed patterns formations today and last 2 sessions therefore Nifty will prepare for decisive moves within 5701-5949 and sustaining beyond this range should be firstly watched for next trend confirmations.

As supports seen at lower levels today therefore we sold 'Puts' also near the higher levels of today which were bought yesterday near lower levels of the day.. Its live proofs will be updated after trading hours today.

Technical Analysis and Market Outlook(04-10-2013)

Nifty-Intra Day Chart (03-Oct-2013):-
Just click on chart for its enlarged view
Technical Patterns and Formations in today intraday charts

1- Sharp up moves in first hour after gap up opening. 
2- Last more than 5 hours trading between 5860-5917 with Bearish Rising Channel formations 
3- Whole day actual trading between 5810-5917

Conclusions from intra day chart analysis 

Closing near the highest of the day after whole day continuous up moves with Bearish Rising Channel formations. Next strong resistance range is between 5896-5938 and today trading below and within this range but without consolidation and above mentioned Bearish pattern formations.  

Certainly complete consolidation is required for crossing and sustaining above the top of resistance(5938) but follow up selling and sustaining below 5860 will mean emergence of correction continuation possibility after Pull Back rally(short covering) completion.

As 5 hours Bearish pattern formations below and within resistance range therefore firstly down moves are expected tomorrow but expected that coming sessions will remain range bound between 5701-5938 and Nifty will prepare for next Long Term Trend within this rang

Nifty Spot-Levels & Trading Strategy for 04-10-2013

Nifty Spot-Levels

R3 6065
R2 5991
R1 5950
Avg 5876
S1 5835
S2 5761
S3 5720

Nifty Spot-Trading Strategy

H6 6026     Trgt 2
H5 5999     Trgt 1
H4 5972     Long breakout
H3 5940     Go Short
H2 5930
H1 5919
L1 5898
L2 5887
L3 5877     Long
L4 5845     Short Breakout
L5 5818     Trgt 1
L6 5791     Trgt 2

Nifty(Oct Fut)-Levels & Trading Strategy for 04-10-2013

Nifty(Oct Fut)-Levels

R3 6176
R2 6086
R1 6026
Avg 5936
S1 5876
S2 5786
S3 5726

Nifty(Oct Fut)-Trading Strategy

H6 6119     Trgt 2
H5 6083     Trgt 1
H4 6048     Long breakout
H3 6007     Go Short
H2 5993
H1 5979
L1 5952
L2 5938
L3 5924     Long
L4 5883     Short Breakout
L5 5848     Trgt 1
L6 5812     Trgt 2

Bank Nifty(Oct Fut)-Levels & Trading Strategy for 04-10-2013

Bank Nifty(Oct Fut)-Levels

R3 10831
R2 10584
R1 10451
Avg 10204
S1 10071
S2 9824
S3 9691

Bank Nifty(Oct Fut)-Trading Strategy

H6 10711     Trgt 2
H5 10619     Trgt 1
H4 10527     Long breakout
H3 10422     Go Short
H2 10387
H1 10352
L1 10283
L2 10248
L3 10213     Long
L4 10109     Short Breakout
L5 10016     Trgt 1
L6  9924     Trgt 2

Pre-closing Outlook(03-10-2013)

Sharp up moves in first hour and after that more than 5 hours trading between 5860-5917 which is within and at lower levels of Next strong resistance range(5896-5938). As last 5 hours up moves are showing Bearish Rising Channel formations therefore more consolidation is required between 5896-5938 tomorrow for strong and fast up moves above 6142.50 and it should be kept in mind that valid break down below 5861 after follow up selling within mentioned resistance range will mean completion of Pull Back Rally(short covering) which started after negative news of USA Shut Down on 01-10-2013.

Mid-session Outlook(03-10-2013)

Rally continuation and fast up moves after consolidation between Gap resistance(5810-5819) and sustaining above it also. Next strong resistance is between 5896-5938 and once sustaining above it will mean confirmation of Wave-2 correction completion and up moves above the top of Wave-1(6142.50).
Crucial Technical Gaps break out is must for Next Big Trend

Nifty-EOD Chart (01-Oct-2013):-
Just click on chart for its enlarged view
Technical Patterns and Formations in EOD charts

1- Bearish Head and Shoulders Pattern formations in 14 sessions
2- Neckline at 5810

Conclusions from EOD chart analysis 

Bearish Head and Shoulders Pattern formations and its Neckline broken down on 30-09-2013 as well as last 2 sessions closing below it. Technically 3 days or minimum 3% closing below Neckline is required for valid break out confirmation of Neckline and it has not happened yet.

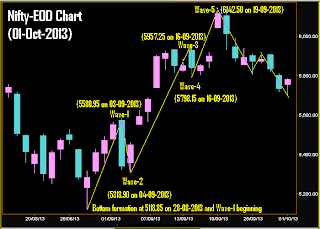
Nifty-EOD Chart (01-Oct-2013):-
Just click on chart for its enlarged view
Technical Patterns and Formations in EOD charts

1- Bottom formation at 5118.85 on 28-08-2013 and Wave-1 beginning
2- Wave-1(5580.95 on 03-09-2013) 
3- Wave-2(5318.90 on 04-09-2013) 
4- Wave-3(5957.25 on 16-09-2013) 
5- Wave-4(5798.15 on 16-09-2013) 
6- Wave-5(6142.50 on 19-09-2013)
7- 'ABC' Correction continuation.
8- Wave-A(5811.10 on 25-09-2013)
9- Wave-B(5917.65 on 26-09-2013)
10- Wave-C bottom formation at 5700.95 on 01-10-2013.
11- Bullish Hammer formation on 01-10-2013. 

Conclusions from EOD chart analysis 

'ABC' Correction continuation and Wave-C bottom formation at 5700.95 on 01-10-2013 but same day good recovery after lower levels supports also even after negative news of 'Shut Down in USA'. As Bullish Hammer Candle formation on 01-10-2013 also therefore sustaining below Wave-C bottom is also required for further correction continuation. 

Nifty-EOD Chart (01-Oct-2013):-
Just click on chart for its enlarged view
Technical Patterns and Formations in EOD charts

1- 200 Day SMA at 5840
2- 200 Day EMA at 5751

Conclusions from EOD chart analysis 

Long Term trend decider 200 Day SMA broken down but Long Term trend decider another average 200 Day EMA has not been broken yet and closing above it on 01-10-2013. Sustaining below 200 Day EMA is must and firstly required for deeper correction.

Nifty-EOD Chart (01-Oct-2013):-
Just click on chart for its enlarged view
Technical Patterns and Formations in EOD charts

1- Gap resistance between 5810-5819
2- Gap support between 5689-5738
3- Gap support between 5460-5553

Conclusions from EOD chart analysis 

Nifty closed at 5780.05 on 01-10-2013 which is between both next Gap support and next Gap resistance. 

Nifty-Intra Day Chart (01-Oct-2013):-
Just click on chart for its enlarged view
Technical Patterns and Formations in today intraday charts

1- Lower levels supports at 5701 after USA Shut Down news. 
2- Whole day up moves in Bearish Rising Channel.
3- Whole day actual trading between 5701-5786

Conclusions from intra day chart analysis 

Lower levels supports and panic bottom formation after USA Shut Down news and whole day up moves also but in Bearish Rising Channel therefore both Bullish and Bearish intraday formations and sustaining beyond today trading range(5701-5786) will be next trend first indication.

Conclusions (After Putting All Indicators Together)

As 'ABC' correction begun after completion of 5 waves of 16 sessions strong rally(5119-6142) therefore correction of whole rally is being seen. Good supports seen at lower levels on 01-10-2013 even after negative news of 'Shut Down in USA' and Bullish Hammer Candle formation also therefore it is correction completion first signal and sustaining below lowest of same day(5701) is must for correction continuation indication.

Nifty closed at 5780.05 on 01-10-2013 with both Bullish and Bearish intraday patterns formations and both deeper correction signals through Bearish Head and Shoulders Pattern and correction completion signal also on 01-10-2013 through lower levels good supports therefore next trend more preparations and formations are required for next trend formations and decisive moves.

Nifty previous closing is between next Gap resistance(5810-5819) and Gap support(5689-5738) and technical positions are mixed therefore Nifty will firstly trade and prepare for next trend and one side moves between 5689-5819 and valid break out of this range will decide:-

1- Rally after correction completion above 5819 or
2- Trend reversal below 5689.    
As technical problems in the Blog therefore Levels have not been updated in last 2 days but will be updated regularly from next Monday