As busy therefore Stock Market Outlook of today is not being updated but Mid-session Outlook may be posted during trading hours.

ॐ ह्रीं श्रीं लक्ष्मीभयो नमः॥

Firstly watch 8574-8711 for next Trend Confirmations
Intra Day Chart Analysis & Market Outlook
(02-08-2016)
Nifty-Intra Day Chart (01-Aug-2016):-
 |
| Just click on chart for its enlarged view |
1- Selling between 8683-8711(Immediate Resistances)
2- Last 3 hours mixed Patterns between 8591-8643
3- Whole day actual trading between 8591-8711
Conclusions from intra day chart analysis
Rally continuation was expected and Nifty traded 72 points also in first 2 hours today but fresh selling developed and Nifty slipped from higher levels. Immediate supports were between 8574-8595 and Nifty got supports within it in last 3 hours but with mixed Patterns between 8591-8643 therefore follow up fresh consolidation is firstly required for fresh up moves above today highest(8711)
As immediate supports and resistances are between 8574-8711 therefore Nifty has to prepare for next decisive moves within and near about this range and finally valid break out of this range will decide next trend which should be firstly watched for confirmations.
Rally continuation Expectations
Technical Analysis,Research & Weekly Outlook
(Aug 01 to Aug 05,2016)
Nifty-EOD Chart (29-Jul-2016):-
 |
| Just click on chart for its enlarged view |
1- Impulsive Wave-1 beginning after bottom formation at 6825.80 on 29-02-2016
2- Wave-1(7992 on 28-04-2016)
3- Wave-2(7678.35 on 06-05-2016)
4- Wave-i of Wave-3(8294.95 on 07-06-2016)
5- Wave-ii of Wave-3(7927.05 on 24-06-2016)
6- Wave-iii of Wave-3 contimuation with recent top formation at 8674.70 on 28-07-2016)
Conclusions from EOD chart analysis
Rally is very much on and its continuation is expected because selling patterns formations not seen on EOD charts.
Intra Day Chart Analysis(29-07-2016)
Nifty-Intra Day Chart (29-Jul-2016):-
 |
| Just click on chart for its enlarged view |
1- Consolidation between 8637-8653
2- Down moves in Bullish Falling Channel
3- Whole day actual trading between 8632-8670
Conclusions from intra day chart analysis
Although closing near the lower levels of the day in sideways 38 points whole day trading but intraday patterns are showing good consolidation patterns formations therefore expected that on going rally will remain continued despite 0.32% negative closing last Friday.
Conclusions (After Putting All Studies Together)
All trends are up and rally is very much on as well as its continuation is expected because consolidation patterns formations was seen in last 2 sessions intraday charts. It is confirm that until clear and complete selling patterns will not develop on EOD and intraday charts till then Short/Intermediate Term correction will not be seen.
As Short/Intermediate Term Indicators have turned overbought therefore correction is very much due but that will happen only after suficient selling patterns formations which has not developed yet therefore on going Wave-iii of Wave-3 will remain continued in the coming week.
Intra Day Chart Analysis &
Market Outlook(29-07-2016)
Nifty-Intra Day Chart (28-Jul-2016):- |
| Just click on chart for its enlarged view |
1- Consolidation Patterns between 8631-8653
2- Whole day actual trading between 8626-8674
Conclusions from intra day chart analysis
Last 2 sessions selling at higher levels of previous resistance range(8575-8652) but fresh consolidation Patterns formations within it between 8631-8653 therefore once sustaining above it will mean fresh fast rally which is expected also after good consolidation today and next resistances are above 8800
Intra Day Chart Analysis & Market Outlook(28-07-2016)
Nifty-Intra Day Chart (27-Jul-2016):-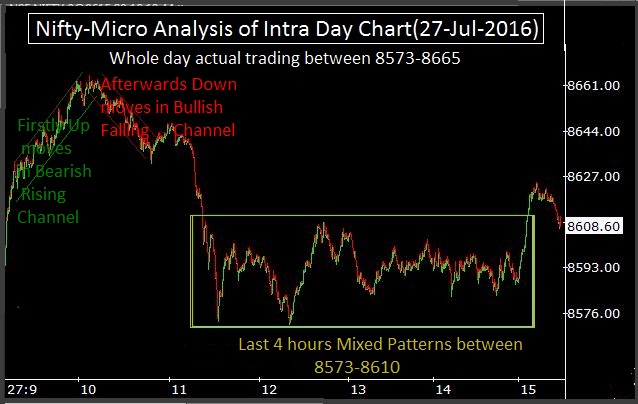 |
| Just click on chart for its enlarged view |
1- Firstly Up moves in Bearish Rising Channel
2- Afterwards Down moves in Bullish Falling Channel
3- Last 4 hours Mixed Patterns between 8573-8610
4- Whole day actual trading between 8573-8665
Conclusions from intra day chart analysis
Following lines were told yesterday in "Intra Day Chart Analysis & Market Outlook(27-07-2016)":-
1- fresh selling was seen today between 8634-8644 which is within previous sessions updated resistance range(8575-8652).
2- As follow up selling within mentioned resistance range(8575-8652) and it has become stronger today
Although strong up moves immediately after opening but not sustaining at higher levels because follow up selling within resistance range was seen yesterday. As only intraday volatility and as such one sided technical position not formations therefore next decisive moves confirmations will be from vaild break out of 8444-8665 which should be firstly watched in the coming sessions.
Intra Day Chart Analysis &
Market Outlook(27-07-2016)
Nifty-Intra Day Chart (26-Jul-2016):-Market Outlook(27-07-2016)
 |
| Just click on chart for its enlarged view |
1- Selling between 8634-8644(Immediate Resistances)
2- Whole day actual trading between 8578-8644
Conclusions from intra day chart analysis
Last 10 sessions sideways trading between 8444-8595 and this range was broken out yesterday despite weaker Global markets sentiments therefore finally rally continuation was expected but fresh selling was seen today between 8634-8644 which is within previous sessions updated resistance range(8575-8652). As today closing also between last 10 sessions sideways trading range(8444-8595) at 8590,65 therefore yesterday break out of 10 sessions range may be false.
As follow up selling within mentioned resistance range(8575-8652) and it has become stronger today therefore more down moves can not be ruled out and complete fresh consolidation is firstly required for decisive up moves above immediate resistance range highest(8652).
Following conclusive line is being repeated which was told on 24-07-2016 in "Valid break out of 8595/8652 will mean Bullish Gates opening":-
valid break out of 8444-8652 should be firstly watched for next decisive moves confirmations.
Rally continuation Expectations
Intra Day Chart Analysis & Market Outlook
(26-07-2016)
Nifty-Intra Day Chart (25-Jul-2016):-
 |
| Just click on chart for its enlarged view |
1- Whole day up moves
2- Whole day actual trading between 8518-8641
Conclusions from intra day chart analysis
Following line was told yesterday in "Valid break out of 8595/8652 will mean Bullish Gates opening":-
As intraday consolidation patterns formations were seen last Friday therefore some up moves can not be ruled out in the beginning of next week
As was told yesterday 100% same happened today and whole day up moves up moves were seen today.
Although flat to weak all Asian markets today morning but Indian markets completely out performed all Global markets and good recovery from lower levels after weak opening today.
Immediate resistances between 8575-8652 were also updated yesterday and Nifty closed within this range today,once its valid break out will mean fresh fast rally because next resistances are above 8800.
Last 10 sessions sideways trading between 8444-8595 and this range is broken out today amid weaker Global markets sentiments therefore expected that finally today started rally will remain continued above 8652 and without sustaining below 8652.
Valid break out of 8595/8652 will mean Bullish Gates opening
Technical Analysis,Research & Weekly Outlook
(Jul 25 to Jul 29,2016)
Nifty-EOD Chart (22-Jul-2016):- |
| Just click on chart for its enlarged view |
1- Impulsive Wave-1 beginning after bottom formation at 6825.80 on 29-02-2016
2- Wave-1(7992 on 28-04-2016)
3- Wave-2(7678.35 on 06-05-2016)
4- Wave-i of Wave-3(8294.95 on 07-06-2016)
5- Wave-ii of Wave-3(7927.05 on 24-06-2016)
6- Wave-iii of Wave-3(recent top formation at 8594.80 on 15-07-2016)
7- Last 10 sessions sideways trading between 8444-8595
Sideways corrections of whole Post-Budget Rally
Nifty-EOD Chart (22-Jul-2016):-
 |
| Just click on chart for its enlarged view |
1- Impulsive Wave-1 beginning after bottom formation at 6825.80 on 29-02-2016
2- Wave-1(7992 on 28-04-2016)
3- Wave-2(7678.35 on 06-05-2016)
4- Wave-3 continuation with recent top formation at 8594.80 on 15-07-2016
5- Sideways corrections after every 2/3 sessions up moves
6- Last 10 sessions sideways trading between 8444-8595
Last 10 sessions Intra Day Chart Analysis
Nifty-Intra Day Chart (Jul 11 to Jul 22,2016):-
 |
| Just click on chart for its enlarged view |
1- Last 10 sessions sideways trading between 8444-8595
Intra Day Chart Analysis(25-07-2016)
Nifty-Intra Day Chart (22-Jul-2016):-
 |
| Just click on chart for its enlarged view |
1- Consolidation between 8490-8510
2- Intraday correction
3- Whole day actual trading between 8490-8548
Conclusions (After Putting All Studies Together)
Trends of Nifty are as follows:-
1- Long Term Trend is up.
2- Intermediate Term Trend is up.
3- Short Term Trend is sideways for the last 10 sessions between 8444-8595.
Nifty gained 1769 points in Post Budget-2016/17 Rally from 29-02-2016 but without any deeper correction and all the corrections were seen through sideways trading. Now again Nifty is range bound between 8444-8595 for the last 10 sessions and finally sustaining it beyond will confirm deeper correction below 8444 and fresh rally beginning first indication above 8595. As immediate resistances are between 8575-8652 and Nifty faced resistance within it in previous weeks therefore next strong rally will be considered after sustaining above 8652.
Rally is very much on and finally its continuation is expected also but Oscillators are overbought and started to show negative divergence also therefore correction is very much due which will get confirmation after sustaining below 8444. As it is the peculiar character of on going rally is of only sideways corrections and no deeper correction therefore firstly sustaining beyond 8444-8652 should be watched for next decisive big moves.
As intraday consolidation patterns formations were seen last Friday therefore some up moves can not be ruled out in the beginning of next week and firstly sustaining beyond 8595/8652 should be watched in next week.
Following topic with 8 months old Huge Inverse Head and Shoulders pattern formations was updated on 10-07-2016:-
As last 10 sessions sideways trading above 8295/8398 between 8444-8595 therefore almost break out confirmation of Inverse Head and Shoulders's Neckline(8336.30) and once valid break out of 8595/8652 will mean 100% confirmation which will mean Bullish Gates opening for 9764.10 and above.
Certainly view is Bullish and only it has to be decided that immediate rally above 8595/8652 or after some more sideways trading between 8444-8595.As some correction for consolidation below 8444 can not be ruled out because Oscillators are overbought therefore valid break out of 8444-8652 should be firstly watched for next decisive moves confirmations.
Finally Rally Continuation after Follow up Consolidation between 8443-8520
Intra Day Chart Analysis & Market Outlook
(12-07-2016)
Nifty-Intra Day Chart (11-Jul-2016):- |
| Just click on chart for its enlarged view |
1- More than 100 points up in 1st minute after gap up opening.
2- More than 6 hours trading between 8443-8467
3- Whole day actual trading between 8426-8475
Conclusions from intra day chart analysis
As 100 points up in 1st minute after gap up opening with more than 6 hours trading at 1.5% higher levels between 8443-8467 therefore strong signal of Indian markets strength and rally continuation possibility above day's highest(8475.25).
Following resistances were updated on 03-07-2016 in "Rally Continuation Expectations towards its Minimum Target at 8543.65" and also have been repeated more than 5 times in previous Outlooks:-
1- 8470-8520
2- 8575-8652
Nifty tested and closed below 1st resistance today and sentiment has also turned heated after strong rally today therefore coming 1/2 sessions may remain sideways between 8443-8520 for follow up consolidation but expected that finally rally will remain continued after fresh consolidation after confirmation of last week correction completion today.
8295/8398 Will Confirm Nifty Target at and above 9764.10
Technical Analysis,Research & Weekly Outlook
(Jul 11 to Jul 15,2016)
Nifty-EOD Chart (08-Jul-2016):- |
| Just click on chart for its enlarged view |
1- Impulsive Wave-1 beginning after bottom formation at 6825.80 on 29-02-2016
2- Wave-1(7992 on 28-04-2016)
3- Wave-2(7678.35 on 06-05-2016)
4- Wave-i of Wave-3(8294.95 on 07-06-2016)
5- Wave-ii of Wave-3(7927.05 on 24-06-2016)
6- Wave-iii of Wave-3(recent top formation at 8398.45 on 04-07-2016)
7- Short Term Correction continuation with recent bottom formation at 8287.55 on 08-07-2016
Huge Inverse Head and Shoulders formations in last 8 months
Nifty-EOD Chart (08-Jul-2016):-
 |
| Just click on chart for its enlarged view |
1- Head formation at 6825.80
2- Neckline of pattern beginning from 8336.30 on 26-10-2015 and completion at 8294.95 on 07-06-2016
3- 8294.95-6825.80= 1469.15 points minimum distance between Head and Neckline
4- Neckline was broken out on 01-07-2016 and last 5 sessions closing above it
5- Inverse Head and Shoulders Neckline broken out confirmation will mean next target of Nifty at 8294.95+1469.15=9764.10
Intra Day Chart Analysis(08-07-2016)
Nifty-Intra Day Chart (08-Jul-2016):-
 |
| Just click on chart for its enlarged view |
1- Sharp down immediately after positive opening
2- Little up moves after strong opening of all European markets
3- More than 6 hours sideways trading with consolidation indications between 8288-8333
4- Whole day actual trading between 8288-8347
Conclusions from intra day chart analysis
Although most Asian markets were weak last Friday morning but Indian markets out performed and opened positive. As Sharp down also immediately after positive opening therefore lost strength and under performed also through little up moves after strong opening of most European markets.
As more than 6 hours sideways trading with consolidation indications also between 8288-8333 therefore up moves beginning above day's highest(8347) have turned alive.
Conclusions (After Putting All Studies Together)
Trends of Nifty are as follows:-
1- Long Term Trend is up.
2- Intermediate Term Trend was sideways within previous 25 sessions most time trading range(8064-8295) but strong signals of its turning up through last 6 sessions closing above it.
3- Short Term Trend has turned down after last week Short Term Correction.
Short Term Correction of Wave-iii of Wave-3 is on and no confirmation of its completion yet. Although correction in previous week but as such good selling was not seen and sufficient consolidation patterns have also developed therefore expected that on going rally will remain continued without too much slipping.
Most Crucial level in the next week will be 8295 because final confirmation of sustaining above it will mean:-
1- Strong indication of last week started Short Term Correction completion
2- Neckline(8295) break out confirmation of last 8 months Huge Inverse Head and Shoulders
3- Fresh rally beginning after Wave-iii of Wave-3 correction completion
Last week correction between 8288-8398 and expected that Nifty will firstly trade within this range in next week,finally valid break out of this range will decide the fate of on going correction but expected that rally will remain continued after follow up consolidation within this range and it should also be kept in mind that confirmation of sustaining above 8295/8398 will open the doors of on going Post Budget Rally target at and above 9764.10 according to Huge Inverse Head and Shoulders formations.
Next Decisive moves Confirmation from 8295-8398 amid Global Markets high Volatility
Intra Day Chart Analysis & Market Outlook
(08-07-2016)
Nifty-Intra Day Chart (07-Jul-2016):- |
| Just click on chart for its enlarged view |
1- Selling between 8333-8345
2- Up moves after strong opening of European markets
3- High volatility in last 2 hours
4- Whole day actual trading between 8318-8361
Conclusions from intra day chart analysis
As soon as intraday charts started to show selling patterns formations then we told following lines today at 12:16 PM in "Mid-session Outlook(07-07-2016)":-
1- intraday charts are showing some selling patterns formations
2- firstly valid break out of today highest(8345.60) should be watched now for next up moves beginning confirmations.
As selling developed immediately after opening today therefore slipping and new intraday lowest formations but strong up moves were also seen immediately after more than 1.25% strong opening of most European markets. We updated 8345.60 for next up moves beginning confirmations and Nifty could not sustain above it and closed below it at 8337.90 despite strong trading of all European markets today.
As Global markets are also highly volatile in last 2/3 sessions and high volatility was seen in last 2 hours of Indian markets also today as well as technical positions reverses in such high news based high volatility therefore it will be better to get next decisive moves confirmation from sustaining beyond 8295-8398.
We told for selling today at 12:16 PM and FIIs and Diis were net sellers in all the segments today which is clear from following figures:-
FII & DII trading activity in Capital Market Segment on 07-Jul-2016:-
FII Trading Data in Derivatives Segment on 07-Jul-2016:-

| ||||||||||||||||
| ||||||||||||||||
FII Trading Data in Derivatives Segment on 07-Jul-2016:-
Mid-session Outlook(07-07-2016)
Although flat market since opening today but intraday charts are showing some selling patterns formations also because Brexit led weakness was seen in all Global markets yesterday and its reaction is being seen in Indian markets today therefore firstly valid break out of today highest(8345.60) should be watched now for next up moves beginning confirmations.
Finally Rally Continuation after Crashing Global markets led Minor Correction
Intra Day Chart Analysis & Market Outlook
(07-07-2016)
Nifty-Intra Day Chart (05-Jul-2016):- |
| Just click on chart for its enlarged view |
1- Consolidation between 8336-8346
2- Double Bottom support between 8320-8328
3- Whole day Down moves in Bullish Falling Channels
4- Whole day actual trading between 8320-8364
Conclusions from intra day chart analysis
Although closing near the lower levels of the day but intraday selling patterns were not seen and on the contrary consolidation with lower levels double bottom supports also developed therefore view will not be Bearish. As consolidation through whole day Down moves in Bullish Falling Channels formations also therefore expected that finally rally above the top(8398.45) of on going rally will remain continued because intraday charts of last 2 sessions have also shown sufficient consolidation patterns formations.
As following news therefore now most European markets are now more than 2.00% down and Dow's Futures is also trading 108 points weak after deep Red closing of most Asian markets:-
1- Dow futures slide almost 100 points as Brexit fears keep nagging
2- European stocks veer lower as Brexit fears keep biting
(Just click above topic links of news and go through in details)
Although Global markets are crashing like today and if such situation lasts till tomorrow also then initial weakness can not be ruled out in Indian markets but finally rally will remain continued after Global markets led minor correction completion because Indian markets out performed after Brexit referendum in previous week and last 3 sessions intraday charts are showing consolidation patterns formations also.
Finally Rally Continuation amid Very Short Term Correction Possibility
Intra Day Chart Analysis & Market Outlook
(05-07-2016)
Nifty-Intra Day Chart (04-Jul-2016):-
 |
| Just click on chart for its enlarged view |
1- Intraday corrections
2- Down moves in Bullish Falling Channels
3- Whole day actual trading between 8365-8398
Conclusions from intra day chart analysis
As some Asian markets were trading strong today morning therefore gap up opening of Indian markets but slipping also after some weakness in most European markets. Although whole day sideways trading within 33 points and today closing near the lower levels of the day but intraday charts are showing consolidation patterns through intraday corrections and Down moves in Bullish Falling Channels also therefore view will remain Bullish. As Short Term Indicators have turned over bought after last 7 sessions Rally therefore Very Short Term correction is due which may be seen any day but finally rally will remain continued above today highest(8398.45).
Rally Continuation Expectations towards its Minimum Target at 8543.65
Technical Analysis,Research & Weekly Outlook
(Jul 04 to Jul 08,2016)
Nifty-EOD Chart (01-Jul-2016):- |
| Just click on chart for its enlarged view |
1- Impulsive Wave-1 beginning after bottom formation at 6825.80 on 29-02-2016
2- Wave-1(7992 on 28-04-2016)
3- Wave-2(7678.35 on 06-05-2016)
4- Wave-i of Wave-3(8294.95 on 07-06-2016)
5- Wave-ii of Wave-3(7927.05 on 24-06-2016)
6- Wave-iii of Wave-3 continuation with recent top formation at 8356.75 on 01-07-2016
Sideways corrections of whole Post-Budget Rally
Nifty-EOD Chart (01-Jul-2016):-
 |
| Just click on chart for its enlarged view |
1- Impulsive Wave-1 beginning after bottom formation at 6825.80 on 29-02-2016
2- Wave-1(7992 on 28-04-2016)
3- Wave-2(7678.35 on 06-05-2016)
4- Wave-3 continuation with recent top formation at 8356.75 on 01-07-2016
5- Sideways corrections after every 2/3 sessions up moves
6- Previous 25 sessions sideways trading range(8064-8295) broken down on 24-06-2016 but not sustaining below it and moved up after lowest formation at 7927.05
7- Previous 25 sessions sideways trading range(8064-8295) broken out and closing above it at 8328.35 on 01-07-2016
Intra Day Chart Analysis(01-07-2016)
Nifty-Intra Day Chart (01-Jul-2016):-
 |
| Just click on chart for its enlarged view |
1- Minor selling patterns formation between 8345-8355
2- Down moves in Bullish Falling Channels
3- Intraday corrections
4- Whole day actual trading between 8309-8356
Conclusions from intra day chart analysis
As Global markets cues were blasting therefore strong gap up opening and consolidation was also seen through sufficient intraday corrections and Down moves in Bullish Falling Channels but minor selling patterns formation also at higher levels of the day therefore some more consolidation is required for sustaining above day's highest. As both buying and selling patterns formations last Friday therefore expected that Nifty will firstly trade and prepare for next decisive moves within or near about day's trading range(8309-8356) in the beginning of next week but high possibility of on going rally continuation because more consolidation patterns formations than selling patterns.
Conclusions (After Putting All Studies Together)
Trends of Nifty are as follows:-
1- Long Term Trend is up through confirmation of sustaining above its decider 200 Day EMA(today at 7863).
2- Intermediate Term Trend was sideways within previous 25 sessions most time trading range(8064-8295) but first signal of its turning up through closing above it at 8328.35 after intraday highest formation at 8356.75 on 01-07-2016.
3- Short Term Trend has turned up after post Brexit strong rally.
It has been seen seen since the beginning of Post Budget-2016/17 Rally that market has corrected and consolidated within sideways trading range after every 2/3 sessions up moves,same was seen on 01-07-2016 also when previous 25 sessions sideways trading range(8064-8295) broken out and closing above it at 8328.35. It is confirm that once sustaining above 8295 will mean fresh rally towards following next resistances:-
1- 8470-8520
2- 8575-8652
As some higher levels intraday selling patterns formation and Bearish "Shooting Star Candle" formation on 01-07-2016 therefore some consolidation is firstly required in next week for fresh rally beginning and sustaining above last 25 sessions highest(8295).
As per Elliott Wave theory "Wave-3 should not be shorter than both Wave-1 and Wave-5". Impulsive Wave-3 is on and it should gain more points than Wave-1 gained.
Wave-i of Wave-3 gained 8294.95-7678.35=616.60 Points
Wave-iii of Wave-3 started from 7927.05 and and as per Elliott Wave theory it should gain minimum 616.60 points because it can not be shorter than Wave-i of Wave-3 therefore its minimum target is at:-
8543.65=7927.05(Wave-iii of Wave-3 started)+616.60(Wave-i of Wave-3)
As some selling patterns formations on 01-07-2016 therefore only sustaining above last 25 sessions highest(8295) should be firstly watched in next week because that will mean Nifty towards minimum target of 24-06-2016 started Wave-ii of Wave-3 at 8543.65. Indian markets are Bullish and expected that finally rally will remain continued towards and above 8543.65 after follow up consolidation in the coming 1/2 sessions.
Emergence of Fresh and Strong rally expectations above 8315 but after Complete Consolidation
Intra Day Chart Analysis & Market Outlook
(01-07-2016)
Nifty-Intra Day Chart (30-Jun-2016):- |
| Just click on chart for its enlarged view |
1- Selling Patterns between 8262-8277
2- 3 Hours Down moves in Bullish Falling Channel
3- Up moves in Bearish Rising Channel
4- Mixed Patterns formations in last 2 hours between 8285-8308
5- Whole day actual trading between 8243-8308
Conclusions from intra day chart analysis
As all the Asian markets were blasting today morning therefore Strong gap up opening of Indian markets but continuous slipping in first 3 hours after some selling. As down moves were in Bullish Falling Channel and all the European markets recovered also after first 15 minutes weakness therefore fast up moves were seen in Indian markets.
Following resistances of Nifty with following line was updated on 16-06-2016 in "Finally Crucial Levels will decide Next Trend amid Brexit led Uncertainty" and were repeated also many times in previous Outlooks:-
1- 8242-8255
2- 8260-8315
3- 8470-8520
4- 8575-8652
(Sustaining above 2nd resistance range(8315) will be fresh strong rally confirmation)
Following topic was updated on 27-06-2016:-
Last 25 sessions most time trading between 8064-8295 and this range was broken down on 24-06-2016 after Brexit referendum but closed within it after lowest formation at 7927.05 and this range was broken out today also but again closed within it at 8287.75. It has been seen in all the post Budget 2016-17 Rally that market has completed all its corrections through sideways trading and it is also expected that on going 25 sessions sideways trading range will also broken out and fresh rally will start above last 25 sessions range highest(8295).
Nifty traded within 2nd resistance range with Mixed Patterns between 8285-8308 today because Up moves in Bearish Rising Channel were also seen within this range therefore Nifty slipped fast from higher levels. As Indian markets completely out performed European markets and moved up on its own technical strength today therefore emergence of fresh and strong rally expectations above 8315 but complete consolidation is firstly required in the coming sessions within or near about last 2 hours trading range(8285-8308) because it is lying between above mentioned 2nd resistance levels(8260-8315) and Mixed Patterns formations were also seen within it today.
Intra Day Chart Analysis & Market
Outlook(30-06-2016)
Nifty-Intra Day Chart (29-Jun-2016):-Outlook(30-06-2016)
 |
| Just click on chart for its enlarged view |
1- First 3 hours trading with mixed Patterns formations between 8158-8186
2- Last 3 hours up moves after strong opening and continuous Rally of European markets
3- Whole day actual trading between 8158-8212
Conclusions from intra day chart analysis
As most Asian markets were trading strong today morning after Dow's rally of 269 points yesterday therefore strong gap up opening of Indian markets but traded sideways between 8158-8186 with mixed Patterns formations because both Up moves in Bearish Rising Channel and Down moves in Bullish Falling Channel were seen within this range.
Although today closing near the higher levels of the day but on the back of continuous more than 01.50% Rally of European markets after strong gap up opening. As Indian markets under performed Global markets and as such good intraday consolidation patterns were also not seen today therefore next trend will be decided according to fresh intraday trading patterns formations in the coming sessions.
As all the Global markets are highly volatile in this week after Braxit referendum and technical positions reverses also in such high volatility therefore sustaining beyond those next supports and resistances will decide next trend which have already been updated at 11:54 AM today in "Next Trend Confirmations from Supports & Resistances after Braxit led High Global markets Volatility"
Next Trend Confirmations from Supports & Resistances after Braxit led High Global markets Volatility
Mid-session Outlook(29-06-2016)
As Indian markets completely under performed Global markets yesterday therefore some down moves were expected today but all the Asian markets were trading with good gains today morning and some were more than 1% up after Dow's rally of 269 points yesterday therefore positive zone trading since opening in Indian markets today.
As selling yesterday therefore not sustaining at higher levels today and new intraday lowest formation at 11:17 AM after loosing all intraday gains.
All the Global markets are highly volatile in this week after Braxit referendum and technical positions reverses also in such high volatility also therefore sustaining beyond following next supports and resistances should be firstly watched for the confirmation of next trend.
Supports:-
1- 8070-8091
2- 7928-7970
Resistances:-
1- 8242-8255
2- 8260-8315
Firstly Watch 8040-8146 amid some Down Moves Expectations
Intra Day Chart Analysis & Market Outlook
(29-06-2016)
Nifty-Intra Day Chart (28-Jun-2016):- |
| Just click on chart for its enlarged view |
1- Mixed Patterns between 8106-8125
2- Slow up moves after more than 2% positive opening of European markets.
3- Minor selling between 8129-8133
4- Whole day actual trading between 8106-8146
Conclusions from intra day chart analysis
Although Whole day Dow's Futures traded 100 to 200 points up and European markets opened more than 2% positive but slow up moves were seen in Indian markets after such strong trading of all European markets therefore selling on the back of strong intraday Global cues can not be ruled out today. As minor selling patterns formations in last hours and first 3 hours trading with mixed Patterns formations therefore view will not be Bullish despite Green closing after whole day positive zone trading today.
Nifty out performed Global markets yesterday between 8040-8120 and under performed Global markets today between 8106-8146 as well as both buying and selling between 8040-8146 in last 2 sessions therefore Nifty will firstly trade and prepare for next trend within this range.
As Indian markets completely under performed Global markets today therefore some down moves below today lowest(8106) is expected in the coming sessions and first indication of next decisive moves will be after valid break out of 8040-8146.
Subscribe to:
Posts (Atom)