Most time 36 points range bound negative zone trading between 6750-6786 with lower levels good consolidation and multiple supports but minor selling was also seen at higher levels therefore valid break out of today trading range will be next immediate moves confirmation but today intraday patterns are showing good consolidation patterns hence high possibility of decisive up moves above today highest(6786.25) despite now trading near the lower of today.

ॐ ह्रीं श्रीं लक्ष्मीभयो नमः॥

Mid-session Outlook-2(28-04-2014)
Although recovery from lower levels after some consolidation but follow up consolidation not seen but some selling was also seen therefore market require some more preparation for next direction and that will be seen in the coming hours. Next immediate moves confirmation will be after valid break out of today trading range(6750-6786) and should be firstly watched now.
Mid-session Outlook(28-04-2014)
Most time negative zone trading since opening today but intraday charts are showing consolidation patterns formations therefore emergence of last week started correction completion possibility and expected that Nifty will not sustain below today lowest(6750.30) and fresh up moves will begin after follow up consolidations.
Technical Analysis,Research & Weekly Outlook(Apr 28 to May 02,2014)
Nifty-EOD Chart (25-Apr-2014):-
Technical Patterns and Formations in EOD charts
1- Wave-iii of Wave-3 beginning(5933.30 on 04-02-2014)
2- 5th Wave continuation with all time high formation at 6869.85 on 25-04-2014
3- Bearish Rising Wedge formation in last 13 sessions.
All trends are up and impulsive Wave-iii of Wave-3 continuation but oscillators are showing negative divergence in overbought zone therefore correction is very much due. As Bearish Rising Wedge formation in last 13 sessions therefore emergence of correction possibility and next supports/resistances are as follows:-
1- Resistances between 6841-6861
2- Resistances between 6818-6836
3- Supports between 6720-6740
4- Supports between 6685-6703
5- Supports between 6651-6671
Indian markets are highly Bullish and many times such markets correct time wise in side ways moves and not price wise therefore possibility of side ways market trading range is 6651-6861 and:-
1- Sustaining below 6651 will be deeper correction confirmation because Bearish Rising Wedge formation in last 13 sessions.
2- Sustaining above 6861 will be fresh rally beginning after Short Term Correction confirmation.
 |
| Just click on chart for its enlarged view |
1- Wave-iii of Wave-3 beginning(5933.30 on 04-02-2014)
2- 5th Wave continuation with all time high formation at 6869.85 on 25-04-2014
3- Bearish Rising Wedge formation in last 13 sessions.
Conclusions from EOD chart analysis
All trends are up and impulsive Wave-iii of Wave-3 continuation but oscillators are showing negative divergence in overbought zone therefore correction is very much due. As Bearish Rising Wedge formation in last 13 sessions therefore emergence of correction possibility and next supports/resistances are as follows:-
1- Resistances between 6841-6861
2- Resistances between 6818-6836
3- Supports between 6720-6740
4- Supports between 6685-6703
5- Supports between 6651-6671
Indian markets are highly Bullish and many times such markets correct time wise in side ways moves and not price wise therefore possibility of side ways market trading range is 6651-6861 and:-
1- Sustaining below 6651 will be deeper correction confirmation because Bearish Rising Wedge formation in last 13 sessions.
2- Sustaining above 6861 will be fresh rally beginning after Short Term Correction confirmation.
Pre-closing Outlook(25-04-2014)
As selling in previous sessions above 6790 therefore we were told for very Short term correction on 23-04-2014 but it is being seen after one sessions ie today and Nifty slipped toward 6773 but minor supports also seen between 6773.6788 today and emergence of 1st signal of correction completion as well.
It should be kept in mind that once sustaining below 6773 will mean correction possibility towards 6725/6669.
Mid-session Outlook-2(25-04-2014)
Although intraday patterns showed consolidation indications but some slipping was expected therefore the range of 6790-6861 was updated in previous Outlook and Nifty formed recent lowest at 6786. As good selling was seen above 6790 therefore down moves below it was expected in previous session but it is being seen today and once sustaining below 8790 will mean deeper correction towards 6725/6669 as well as must be kept in mind.
Mid-session Outlook(25-04-2014)
Although markets recovered from lower levels in last minutes on 23-04-2014 but higher levels selling was also seen between 6841-6861 therefore Nifty could not sustain above it and trading below it since opening today. As intraday patterns are showing consolidation indications therefore expected that Nifty will firstly trade and prepare for next decisive moves between 6790-6861 and valid break out of this range will be next trend confirmation.
Technical Analysis and Market Outlook(25-04-2014)
Nifty-Intra Day Chart (23-Apr-2014):-
Technical Patterns and Formations in today intraday charts
1- Selling between 6841-6861
2- Strong recovery after new intraday lowest formations
3- Whole day actual trading between 6821-6861
All trends are up and Indian markets are highly Bullish therefore consolidating at higher levels without giving deeper correction. Although good selling seen in previous sessions but market recovered from lower levels in last minutes without giving deeper correction despite higher levels selling today.
Impulsive Wave-iii of Wave-3 continuation and its continuation will be considered until complete selling patterns will not develop. Indian Stock markets are discounting Modi factor and expectations are at peak all around therefore cautious approach is required because euphoria is being developed and markets are moving up under most Bullish sentiments.
 |
| Just click on chart for its enlarged view |
1- Selling between 6841-6861
2- Strong recovery after new intraday lowest formations
3- Whole day actual trading between 6821-6861
Conclusions from intra day chart analysis
All trends are up and Indian markets are highly Bullish therefore consolidating at higher levels without giving deeper correction. Although good selling seen in previous sessions but market recovered from lower levels in last minutes without giving deeper correction despite higher levels selling today.
Impulsive Wave-iii of Wave-3 continuation and its continuation will be considered until complete selling patterns will not develop. Indian Stock markets are discounting Modi factor and expectations are at peak all around therefore cautious approach is required because euphoria is being developed and markets are moving up under most Bullish sentiments.
FII & DII trading activity in Capital Market Segment on 23-Apr-2014
| ||||||||||||||||
| ||||||||||||||||
Indian Stock Markets Closing Reports(23-Apr-2014)
Main features of today trading are as follows
Ratios
Index Options Put Call Ratio: 1.03
Total Options Put Call Ratio: 0.99
Nifty P/E Ratio(23-Apr-2014): 19.20
Nifty P/B Ratio(23-Apr-2014): 3.30
Dividend Yield (23-Apr-2014): 1.34
Advances & Declines
BSE Advances : 1,428
BSE Declines : 1,372
NSE Advances : 783
NSE Declines : 748
Nifty Open Interest Changed Today
Nifty- 6700 CE(May)- -9,150(-1.17%)
Nifty- 6700 PE(May)- 148,350(15.37%)
Nifty- 6800 CE(May)- 41,250(2.65%)
Nifty- 6800 PE(May)- 471,350(%)
Nifty- 6900 CE(May)- 623,800(52.95%)
Nifty- 6900 PE(May)- 305,150(47.44%)
Nifty- 7000 CE(May)- 484,000(23.35%)
Nifty- 7000 PE(May)- 113,100(19.17%)
Closing
Sensex- closed at 22,876.54(118.17 Points & 0.52%)
Nifty- closed at 6,840.80(25.45 Points & 0.37%)
CNX Midcap - closed at 8,902.20(-1.60 Points & -0.02%)
CNX Smallcap- closed at 3,999.35(6.55 Points & 0.16%)
Nifty Spot-Levels & Trading Strategy for 25-04-2014
Nifty Spot-Levels
R3 6901
R2 6881
R1 6860
Avg 6840
S1 6819
S2 6799
S3 6778
Nifty Spot-Trading Strategy
H6 6881 Trgt 2
H5 6871 Trgt 1
H4 6862 Long breakout
H3 6851 Go Short
H2 6847
H1 6843
L1 6836
L2 6832
L3 6828 Long
L4 6817 Short Breakout
L5 6808 Trgt 1
L6 6798 Trgt 2
R3 6901
R2 6881
R1 6860
Avg 6840
S1 6819
S2 6799
S3 6778
Nifty Spot-Trading Strategy
H6 6881 Trgt 2
H5 6871 Trgt 1
H4 6862 Long breakout
H3 6851 Go Short
H2 6847
H1 6843
L1 6836
L2 6832
L3 6828 Long
L4 6817 Short Breakout
L5 6808 Trgt 1
L6 6798 Trgt 2
Nifty(May Fut)-Levels & Trading Strategy for 25-04-2014
Nifty(May Fut)-Levels
R3 6953
R2 6931
R1 6915
Avg 6893
S1 6877
S2 6855
S3 6839
Nifty(May Fut)-Trading Strategy
H6 6937 Trgt 2
H5 6928 Trgt 1
H4 6919 Long breakout
H3 6909 Go Short
H2 6905
H1 6902
L1 6895
L2 6892
L3 6888 Long
L4 6878 Short Breakout
L5 6869 Trgt 1
L6 6860 Trgt 2
R3 6953
R2 6931
R1 6915
Avg 6893
S1 6877
S2 6855
S3 6839
Nifty(May Fut)-Trading Strategy
H6 6937 Trgt 2
H5 6928 Trgt 1
H4 6919 Long breakout
H3 6909 Go Short
H2 6905
H1 6902
L1 6895
L2 6892
L3 6888 Long
L4 6878 Short Breakout
L5 6869 Trgt 1
L6 6860 Trgt 2
Bank Nifty(May Fut)-Levels & Trading Strategy for 25-04-2014
Bank Nifty(May Fut)-Levels
R3 13565
R2 13421
R1 13327
Avg 13183
S1 13089
S2 12945
S3 12851
Bank Nifty(May Fut)-Trading Strategy
H6 13475 Trgt 2
H5 13420 Trgt 1
H4 13364 Long breakout
H3 13299 Go Short
H2 13277
H1 13255
L1 13212
L2 13190
L3 13168 Long
L4 13103 Short Breakout
L5 13047 Trgt 1
L6 12992 Trgt 2
R3 13565
R2 13421
R1 13327
Avg 13183
S1 13089
S2 12945
S3 12851
Bank Nifty(May Fut)-Trading Strategy
H6 13475 Trgt 2
H5 13420 Trgt 1
H4 13364 Long breakout
H3 13299 Go Short
H2 13277
H1 13255
L1 13212
L2 13190
L3 13168 Long
L4 13103 Short Breakout
L5 13047 Trgt 1
L6 12992 Trgt 2
Mid-session Outlook(23-04-2014)
As good selling in previous sessions therefore very Short Term correction was expected but Indian markets are showing extreme strength today. Although continuous recovery since opening but very Short Term correction is very much due and still expected.
Technical Analysis and Market Outlook(23-04-2014)
Nifty-Intra Day Chart (22-Apr-2014):-
Technical Patterns and Formations in today intraday charts
1- Selling between 6821-6838
2- Whole day actual trading between 6807-6838
Following lines were told in previous Outlooks:-
1- At 11:44 AM in Mid-session Outlook(22-04-2014):- "today intraday charts are showing selling patterns"
2- At 02:58 PM in Pre-closing(21-04-2014):- "confirmation through sustaining above 6819 is required for strong rally in new zone"
3- In Technical Analysis and Market Outlook(22-04-2014):- "some selling also seen below 6825 therefore sustaining above it is must for next strong rally and should be firstly watched tomorrow"
Selling was seen yesterday and follow up good selling was seen today also therefore it was updated at 11:44 AM when Nifty was trading near higher levels of the day. As good selling was seen today therefore expected that Nifty will slip below today lowest and very Short term correction is expected tomorrow with April expiry possibility near or below 6750 despite Dow Jones is now trading 100 points up.
 |
| Just click on chart for its enlarged view |
1- Selling between 6821-6838
2- Whole day actual trading between 6807-6838
Conclusions from intra day chart analysis
Following lines were told in previous Outlooks:-
1- At 11:44 AM in Mid-session Outlook(22-04-2014):- "today intraday charts are showing selling patterns"
2- At 02:58 PM in Pre-closing(21-04-2014):- "confirmation through sustaining above 6819 is required for strong rally in new zone"
3- In Technical Analysis and Market Outlook(22-04-2014):- "some selling also seen below 6825 therefore sustaining above it is must for next strong rally and should be firstly watched tomorrow"
Selling was seen yesterday and follow up good selling was seen today also therefore it was updated at 11:44 AM when Nifty was trading near higher levels of the day. As good selling was seen today therefore expected that Nifty will slip below today lowest and very Short term correction is expected tomorrow with April expiry possibility near or below 6750 despite Dow Jones is now trading 100 points up.
Pre-closing Outlook(22-04-2014)
Although most time positive zone trading and European markets are also .65% to !.05% up at this moment but today intraday are showing selling pattern formations therefore down moves are expected below today lowest(6808).
Mid-session Outlook(22-04-2014)
Whole day positive zone trading after Green opening and new all time high formation as well but today intraday charts are showing selling patterns.
Technical Analysis and Market Outlook(22-04-2014)
Nifty-Intra Day Chart (21-Apr-2014):-
Technical Patterns and Formations in today intraday charts
1- Consolidation between 6787-6798
2- 5 Hours sideways trading between 6787-6806
3- Up moves without required force
4- Not sustaining above previous top(6819)
5- Whole day actual trading between 6787-6825
Firstly 5 hours sideways trading between 6787-6806 with lower levels consolidation between 6787-6798 and after that range broken out but without required force therefore Nifty could not sustain at higher levels.
Last 7 sessions actual trading between 6651-6819 with higher levels selling between 6806-6819 therefore it is must to sustain above 6819 for fresh strong rally therefore following line was told at 02:58 PM in Pre-closing Outlook when Nifty was trading at 6823:-
 |
| Just click on chart for its enlarged view |
1- Consolidation between 6787-6798
2- 5 Hours sideways trading between 6787-6806
3- Up moves without required force
4- Not sustaining above previous top(6819)
5- Whole day actual trading between 6787-6825
Conclusions from intra day chart analysis
Firstly 5 hours sideways trading between 6787-6806 with lower levels consolidation between 6787-6798 and after that range broken out but without required force therefore Nifty could not sustain at higher levels.
Last 7 sessions actual trading between 6651-6819 with higher levels selling between 6806-6819 therefore it is must to sustain above 6819 for fresh strong rally therefore following line was told at 02:58 PM in Pre-closing Outlook when Nifty was trading at 6823:-
confirmation through sustaining above 6819 is required for strong rally in new zone.
As up moves without required force therefore Nifty could not sustain at higher levels and slipped toward 5810.75 in last minutes. Although Nifty closed at all time high today but some selling also seen below 6825 therefore sustaining above it is must for next strong rally and should be firstly watched tomorrow.
Pre-closing Outlook(21-04-2014)
Nifty cleared last resistance range(6806-6819) after 5 hours follow up consolidation between 6787-6806 but not forcefully therefore confirmation through sustaining above 6819 is required for strong rally in new zone.
Mid-session Outlook(21-04-2014)
First 2 hours 18 points sideways trading between 6788-6806 today and technical positions just below and just above it are as follows:-
1- Selling between 6806-6819 on 10-04-2014
2- Mixed Patterns between 6762-6783 on 17-04-2014
1- Selling between 6806-6819 on 10-04-2014
2- Mixed Patterns between 6762-6783 on 17-04-2014
Certainly Nifty is preparing for next big moves today and valid break out of 6762-6819 will be its confirmation.
Technical Analysis,Research & Weekly Outlook(Apr 21 to Apr 25,2014)
Nifty-EOD Chart (17-Apr-2014):-
Technical Patterns and Formations in EOD charts
1- Wave-iii of Wave-3 beginning(5933.30 on 04-02-2014)
2- 5th Wave continuation with all time high formation at 6819.05 on 10-04-2014
3- Last 7 Sessions trading between 6651-6819
Conclusions from EOD chart analysis
Wave-iii of Wave-3 is on with its 5th wave highest formation at 6819.05 and last 7 sessions range bound trading between 6651-6819.
Nifty-Intra Day Chart (Apr 07 to Apr 17,2014):-
Technical Patterns and Formations in last 7 Sessions intraday charts
1- Selling between 6806-6819 on 10-04-2014
2- Consolidation between 6651-6671 on 07-04-2014
3- consolidation between 6706-6732 on 09-04-2014
4- Consolidation between 6720-6740 on 17-04-2014
5- Mixed Patterns between 6762-6783 on 17-04-2014
6- 7 Sessions actual trading between 6651-6819
Conclusions from 7 Sessions intra day chart analysis
7 Sessions actual trading between 6651-6819 with lower levels good supports and now last resistances are between 6806-6819 therefore follow up consolidation is firstly required for fresh rally above 6819. As strong supports emerged at lower levels in last 7 sessions therefore complete selling is required for any decisive down moves below the lowest the lowest of last 7 sessions(6651)
Nifty-Intra Day Chart (17-Apr-2014):-
Technical Patterns and Formations in today intraday charts
1- Consolidation between 6685-6699
2- Follow up consolidation between 6720-6740
3- Mixed Patterns between 6762-6783
4- Whole day actual trading between 6685-6783
Conclusions from intra day chart analysis
Strong 99 points rally after lower levels consolidation and follow up consolidation as well between 6720-6740 and confirmation of Short term correction completion. As mixed patterns formations between 6762-6783 in last 2 hours therefore follow up consolidation is firstly required for decisive up moves and sustaioning above the highest of the day(6783)
All trends are up and impulsive Wave-iii of Wave-3 continuation but oscillators are showing negative divergence in overbought zone therefore correction is very much due. Indian markets are highly Bullish and many times such markets correct time wise in side ways moves and not price wise. As last 7 sessions were range bound therefore time wise correction possibility can not be ruled out.
Strong supports developed at lower levels and selling was also seen in last 7 sessions between 6651-6819 as well as weekly Bearish Hanging Man Candle formation in previous week therefore expected that Indian markets will firstly remain sideways between 6651-6819 in the beginning of next week and sustaining beyond this range will decide the length and life of ongoing correction.
Next moves beyond 6651-6819 will be as follows:-
1- Sustaining above 6819 will mean strong rally after Short Term Correction completion
2- Sustaining below 6651 will mean correction of whole that up move which started from 5933.30.
 |
| Just click on chart for its enlarged view |
1- Wave-iii of Wave-3 beginning(5933.30 on 04-02-2014)
2- 5th Wave continuation with all time high formation at 6819.05 on 10-04-2014
3- Last 7 Sessions trading between 6651-6819
Conclusions from EOD chart analysis
Wave-iii of Wave-3 is on with its 5th wave highest formation at 6819.05 and last 7 sessions range bound trading between 6651-6819.
Nifty-Intra Day Chart (Apr 07 to Apr 17,2014):-
 |
| Just click on chart for its enlarged view |
1- Selling between 6806-6819 on 10-04-2014
2- Consolidation between 6651-6671 on 07-04-2014
3- consolidation between 6706-6732 on 09-04-2014
4- Consolidation between 6720-6740 on 17-04-2014
5- Mixed Patterns between 6762-6783 on 17-04-2014
6- 7 Sessions actual trading between 6651-6819
Conclusions from 7 Sessions intra day chart analysis
7 Sessions actual trading between 6651-6819 with lower levels good supports and now last resistances are between 6806-6819 therefore follow up consolidation is firstly required for fresh rally above 6819. As strong supports emerged at lower levels in last 7 sessions therefore complete selling is required for any decisive down moves below the lowest the lowest of last 7 sessions(6651)
Nifty-Intra Day Chart (17-Apr-2014):-
 |
| Just click on chart for its enlarged view |
1- Consolidation between 6685-6699
2- Follow up consolidation between 6720-6740
3- Mixed Patterns between 6762-6783
4- Whole day actual trading between 6685-6783
Conclusions from intra day chart analysis
Strong 99 points rally after lower levels consolidation and follow up consolidation as well between 6720-6740 and confirmation of Short term correction completion. As mixed patterns formations between 6762-6783 in last 2 hours therefore follow up consolidation is firstly required for decisive up moves and sustaioning above the highest of the day(6783)
Conclusions (After Putting All Studies Together)
All trends are up and impulsive Wave-iii of Wave-3 continuation but oscillators are showing negative divergence in overbought zone therefore correction is very much due. Indian markets are highly Bullish and many times such markets correct time wise in side ways moves and not price wise. As last 7 sessions were range bound therefore time wise correction possibility can not be ruled out.
Strong supports developed at lower levels and selling was also seen in last 7 sessions between 6651-6819 as well as weekly Bearish Hanging Man Candle formation in previous week therefore expected that Indian markets will firstly remain sideways between 6651-6819 in the beginning of next week and sustaining beyond this range will decide the length and life of ongoing correction.
Next moves beyond 6651-6819 will be as follows:-
1- Sustaining above 6819 will mean strong rally after Short Term Correction completion
2- Sustaining below 6651 will mean correction of whole that up move which started from 5933.30.
Pre-closing Outlook(17-04-2014)
Following lines were told today:-
1- At 09:34 AM in Post-open Outlook- if Nifty sustain above 6703 then it will be first signal of some up moves and Indian markets turning into range bound mode between 6651-6819.
2- At 10:37 AM in Mid-session Outlook- consolidation also seen between 6685-6700 today therefore previous supports strengthened and strong signals of fresh up moves
Strong 99 points up moves from lower levels of today after Short term correction completion and next resistances are between 6806-6819 therefore only sustaining above 6819 has to be watched in next week for strong rally and new historical highs formations.
Mid-session Outlook(17-04-2014)
Next support range was between 6651-6671 and it was tested yesterday but consolidation also seen between 6685-6700 today therefore previous supports strengthened and strong signals of fresh up moves. Now Indian markets will be understood range bound between 6651-6819 and fresh rally with new highs formations after correction completion will be considered after sustaining above some higher levels resistances.
Post-open Outlook(17-04-2014)
As US markets closed with good gains yesterday therefore sentiment is good and positive opening in Indian markets. Follow up selling was seen between 5692-6703 yesterday and first 15 minutes most time trading between this range today. As very Short Term indicators are oversold therefore if Nifty sustain above 6703 then it will be first signal of some up moves and Indian markets turning into range bound mode between 6651-6819.
Next immediate moves confirmation first signal will be valid break out of 5692-6703 today
Technical Analysis and Market Outlook(17-04-2014)
Nifty-Intra Day Chart (16-Apr-2014):-
Technical Patterns and Formations in today intraday charts
1- Selling between 5738-6765
2- Follow up selling between 5692-6703
3- Whole day actual trading between 6665-6748
Firstly higher levels selling and after that follow up selling as well as testing of next support range(6651-6671) today. Long and Intermediate Trends are up,Short Term Trend turned down and correction continuation. Last hope for Bulls is 6651 and once sustaining below 6651 will mean sharp fall because next supports are at much lower levels near 6500.
 |
| Just click on chart for its enlarged view |
1- Selling between 5738-6765
2- Follow up selling between 5692-6703
3- Whole day actual trading between 6665-6748
Conclusions from intra day chart analysis
Firstly higher levels selling and after that follow up selling as well as testing of next support range(6651-6671) today. Long and Intermediate Trends are up,Short Term Trend turned down and correction continuation. Last hope for Bulls is 6651 and once sustaining below 6651 will mean sharp fall because next supports are at much lower levels near 6500.
Pre-closing Outlook(16-04-2014)
Support at 6706 broken down forcefully after higher levels selling between 6724.65-6748.65 and down moves seen towards next supports range(6651-6671). Short Term correction is on and much deeper correction will be seen below 6651 but follow up selling is must for sustaining below 6651 because good supports are lying between 6651-6671.
Mid-session Outlook(16-04-2014)
Following line with levels was updated in last 3 Outlooks:-
As Nifty traded between 6724.65-6748.65 today with some consolidation and selling therefore only sustaining beyond 6706-6748 should watched watched for next immediate trend confirmations.
Valid break out of 6706-6748 will be next immediate moves confirmation
As Nifty traded between 6724.65-6748.65 today with some consolidation and selling therefore only sustaining beyond 6706-6748 should watched watched for next immediate trend confirmations.
Post-open Outlook(16-04-2014)
As selling indications with Bearish Engulfing Candle formation therefore flat Indian markets despite good Global cues. Some indications of consolidation also developed in first hour of trading today therefore correction completion will also be considered because today and yesterday trading is seen within next support range(6706-6732).
Valid break out of 6706-6748 will be next immediate moves confirmation and should be firstly watched.
Pre-open Outlook(16-04-2014)
All the Asian markets are in Green and some are trading with good gains as well therefore sentiment is positive today morning because Dow's Futures is also now more than 50 points up after US markets closing with sufficient gains yesterday. As Bearish Engulfing Candle formation with selling indications yesterday therefore firstly next immediate moves confirmation is must through sustaining beyond 6706-6748 in today like boosted sentiment.
Technical Analysis and Market Outlook(16-04-2014)
Nifty-Intra Day Chart (15-Apr-2014):-
Technical Patterns and Formations in today intraday charts
1- Almost whole day trading between 6712-6748
2- Whole day actual trading between 6712-6813
Firstly sharp 100 points down in first 10 minutes and after that almost whole day 36 points narrow range trading between 6712-6748 which was almost within next support range(6706-6732) also. As whole day trading at such lower rates therefore follow up selling and more down moves possibility can not be ruled out today.
 |
| Just click on chart for its enlarged view |
1- Almost whole day trading between 6712-6748
2- Whole day actual trading between 6712-6813
Conclusions from intra day chart analysis
Firstly sharp 100 points down in first 10 minutes and after that almost whole day 36 points narrow range trading between 6712-6748 which was almost within next support range(6706-6732) also. As whole day trading at such lower rates therefore follow up selling and more down moves possibility can not be ruled out today.
Bearish Engulfing Candle formation also today therefore once valid breaking down of 6706 will mean sharp down towards next supports 6651-6671 and its possibility is very much alive today and valid break out of 6706-6748 will be next immediate moves confirmation.
Mid-session Outlook-2(15-04-2014)
More than 4 hours trading between 6712-6740 and range broken out but sustaining above 6740 will mean 4th corrective wave completion and beginning of 5th impulsive wave of Bearish Rising Wedge.
Mid-session Outlook(15-04-2014)
Following support range was updated in View is Cautiously Bullish
Nifty is trading between 6712-6740 after first 10 minutes sharp fall and valid break out of 6706-6740 will be next immediate moves confirmation.
3- Next 2nd supports are between 6706-6732
Nifty is trading between 6712-6740 after first 10 minutes sharp fall and valid break out of 6706-6740 will be next immediate moves confirmation.
Post-open Outlook(15-04-2014)
As Bearish Rising Wedge like formation being developed in previous week and selling also seen between 6806-6819 last Thursday therefore Nifty retraced from 6813.40 after positive opening. As Wave-5 of Bearish Rising Wedge is still left therefore Up moves above 6819.05 were expected and following topic was updated at 12:37 AM today:-
Certainly correction is due and very short Term correction is being seen today but good supports also above 6651 therefore follow up selling is must for sustaining it below and deeper correction. Next immediate trend confirmation range is 6651-6819 and should be kept in mind.
View is Cautiously Bullish
Technical Analysis,Research & Weekly Outlook
(Apr 15 to Apr 017,2014)
Nifty-EOD Chart (11-Apr-2014):-
 |
| Just click on chart for its enlarged view |
1- Bottom formation at 5118.85 on 28-08-2013 and Wave-1 beginning
2- Wave-1(6142.50 on 19-09-2013)
3- Wave-2(5700.95 on 01-10-2013)
4- Wave-i of Wave-3(6415.25 on 09-12-2013)
5- Wave-ii of Wave-3(5933.30 on 04-02-2014)
6- Wave-iii of Wave-3 continuation with new highest formation at 6819.05 on 10-04-2014
Conclusions from EOD chart analysis
All trends are up and Bullish market Wave-iii of Wave-3 continuation towards those higher levels which can not be easily imagined at this moment because following minimum waves are still left:-
1- Wave-iii of Wave-3 continuation and no signal of its termination yet.
2- Corrective Wave-iv of Wave-3 will start after on going Wave completion and this corrective will correct whole that up move which started from 5933.30.
3- Impulsive Wave-v of Wave-3 will start after previous corrective wave completion and this Wave will form new high above the top of Wave-iii of Wave-3. It should also be kept in mind that Wave-iii of Wave-3 top formations confirmation has not been seen yet.
4- Wave-v of Wave-3 completion will mean termination of Wave-3 and corrective Wave-4 beginning.
5- Corrective Wave-4 will correct whole up moves which started from 5700.95.
6- Impulsive Wave-5 will start towards new top formation above the top of Wave-3.
Nifty-EOD Chart (11-Apr-2014):-
 |
| Just click on chart for its enlarged view |
1- Wave-iii of Wave-3 beginning(5933.30 on 04-02-2014)
2- 5th Wave continuation
2- 4th wave of Bearish Rising Wedge like formation
Conclusions from EOD chart analysis
Wave-iii of Wave-3 is on and 4th wave of Bearish Rising Wedge like formation but its 5th Wave is still left which should move above the previous top at 6819.05.
Nifty-Intra Day Chart (11-Apr-2014):-
 |
| Just click on chart for its enlarged view |
1- Down moves in Bullish falling channel.
2- Consolidation between 6744-6762
3- Whole day actual trading between 6744-6789
Conclusions from intra day chart analysis
Indian markets out performed Global cues and firstly down moves in Bullish Falling Channel with triple bottom formations near 6744 as well as good consolidation seen therefore 6744-6762 has developed a strong support range,until Nifty will not sustain below 6744 after complete selling till then next down moves will not be considered.
Conclusions (After Putting All Studies Together)
At present impulsive Wave-iii of Wave-3 continuation and 1st signal of its completion developed in previous week because emergence of Bearish Rising Wedge like formation. As its 5th impulsive Wave is still left therefore some more up moves above 6819.05 are still left. Next resistances and supports are as follows:-
1- Next resistances are between 6806-6819
2- Next 1st supports are between 6744-6762
3- Next 2nd supports are between 6706-6732
4- Next 3rd supports are between 6651-6671
Expected that Nifty will firstly trade and prepare for next trend between 6744-6819 and sustaining it beyond should be watched in next week for next trend confirmations but view is cautiously Bullish because Bearish Rising Wedge like formation being developed and its 5th wave is still.
Up moves above 6819.05 are still expected because good supports also developed at lower levels in previous week therefore easily deeper correction will not be seen and much more selling is still left for it and let it happen then will be considered.
Live Proofs of Indian Stock Markets 100% Accurate Predictions
When Nifty was trading near the lowest of today then following lines were told with the reasons of our Bullish views at 1:36:00 PM in Mid-session Outlook(11-04-2014)
1- emergence of 1st signal of yesterday started correction completion.
2- rally continuation will be seen above 6819 in next week despite sharp fall in last half hour and now trading at 6750 which near the lowest of today.
Only Bullish views were expressed and Nifty did not slipped below 6750 after our above Outlook and and Nifty traded also at 6789 after crossing previous intraday highest(6780.40).
Pre-closing Outlook(11-04-2014)
As good supports at 6744 today therefore until Nifty will not sustain below it till then any decisive down moves will not be considered and firstly sustaining beyond 6744-6819 should be watched in next week for next trend confirmations but view is cautiously Bullish.
Mid-session Outlook(11-04-2014)
As Indian markets showed less weakness than most Global markets therefore out performance of Indian markets today. Down moves in Bullish Falling Channel with triple bottom formations near today lowest(6744) also seen today therefore emergence of 1st signal of yesterday started correction completion.
If Nifty does not sustain below 6744 in the next 1/2 sessions then rally continuation will be seen above 6819 in next week despite sharp fall in last half hour and now trading at 6750 which near the lowest of today.
Now sustaining beyond 6744 should be firstly watched for next next immediate trend confirmations.
Live Proofs of Indian Stock Markets 100% Accurate Predictions
Following line was told at 01:39 PM yesterday in Mid-session Outlook(10-04-2014):-
Most time positive zone trading but some selling patterns formations also seen today.
Selling was clearly told when Nifty was trading near the higher levels of the day and last traded price of yesterday was at the lowest of the day at 6777.30 and Nifty traded 51 points down today.
Following line was told at 01:15 PM on 09-04-2014 in Mid-session Outlook(09-04-2014):-
expectations are alive for rally continuation above 6776 in the coming sessions.
Nifty jumped 70 points after our above projection and crossed 9776 same day on 09-04-2014
Post-open Outlook(11-04-2014)
As indicators were overbought therefore Very Short Short Term Correction was due and being seen today. Nifty will remain sideways and prepare for next trend between 6706-6819. Follow up moves within and near about this range will decide next trend and valid break out of this range should be watched for next immediate trend confirmations.
Technical Analysis and Market Outlook(11-04-2014)
Nifty-Intra Day Chart (10-Apr-2014):-
Technical Patterns and Formations in today intraday charts
1- Selling between 6806-6819
2- Whole day actual trading between 6778-6819
Last traded price of today is at the lowest of the day at 6777.30 but when Nifty was trading near the higher levels of the day then following lines were clearly told at 01:39 PM today in Mid-session Outlook(10-04-2014):-
when Nifty was trading near the lower levels of the day yesterday then following line was told at 01:15 PM yesterday in Mid-session Outlook:-
Technical positions of last 2 sessions are as follows:-
1- Good consolidation between 6706-6732 yesterday and this range will be next support.
2- Good selling between 6806-6819 today and this range will be next resistance.
 |
| Just click on chart for its enlarged view |
1- Selling between 6806-6819
2- Whole day actual trading between 6778-6819
Conclusions from intra day chart analysis
Last traded price of today is at the lowest of the day at 6777.30 but when Nifty was trading near the higher levels of the day then following lines were clearly told at 01:39 PM today in Mid-session Outlook(10-04-2014):-
Most time positive zone trading but some selling patterns formations also seen today.
when Nifty was trading near the lower levels of the day yesterday then following line was told at 01:15 PM yesterday in Mid-session Outlook:-
expectations are alive for rally continuation above 6776 in the coming sessions.
Technical positions of last 2 sessions are as follows:-
1- Good consolidation between 6706-6732 yesterday and this range will be next support.
2- Good selling between 6806-6819 today and this range will be next resistance.
As lower levels good supports and higher levels good selling between 6706-6819 in last 2 sessions therefore Nifty will remain sideways and prepare for next trend between this range tomorrow and follow up moves within and near about this range will decide next trend.
Let market prepare for next trend between 6706-6819 then next trend will be decided according to intraday charts patterns formations and will be updated accordingly as being done for the last 4 years.
Pre-closing Outlook(10-04-2014)
As soon as selling patterns developed then it was updated at 01:39PM in Mid-session Outlook and Nifty is going to close near the lower levels of the day.
Range bound trading between 6782-6819 with selling patterns formation also therefore follow up moves and valid break out of mentioned trading range will be watched for next immediate very Short Term Trend confirmations but possibility of slipping below the lowest of today.
Range bound trading between 6782-6819 with selling patterns formation also therefore follow up moves and valid break out of mentioned trading range will be watched for next immediate very Short Term Trend confirmations but possibility of slipping below the lowest of today.
Mid-session Outlook(10-04-2014)
Most time positive zone trading but some selling patterns formations also seen today.
Pre-open Outlook(10-04-2014)
As most Asian markets are trading in Red therefore weak opening is possible in Indian markets also but following line should be kept in mind which have been told more than 50 times in last 2 months:-
Just click following topic link which was updated on 30-03-2014 and understand further rally with those minimum waves which are still left
Indian markets are most Bullish and until complete selling patterns will not develop till then deeper correction will not be seen. Although indicators are overbought but it should also be kept in mind that Bull markets complete its correction in sideways trading also.
Just click following topic link which was updated on 30-03-2014 and understand further rally with those minimum waves which are still left
Technical Analysis and Market Outlook(10-04-2014)
Nifty-Intra Day Chart (09-Apr-2014):-
Technical Patterns and Formations in today intraday charts
1- Almost 5 hours consolidation between 6706-6732
3- Whole day actual trading between 6706-6808
Firstly almost 5 hours consolidation between 6706-6732 and after that 70 points strong rally and new all time highest formation at 6808.70 but when Nifty was trading at 6720.20 then following line was told today at 01:15 PM in Mid-session Outlook(09-04-2014);-
 |
| Just click on chart for its enlarged view |
1- Almost 5 hours consolidation between 6706-6732
3- Whole day actual trading between 6706-6808
Conclusions from intra day chart analysis
Firstly almost 5 hours consolidation between 6706-6732 and after that 70 points strong rally and new all time highest formation at 6808.70 but when Nifty was trading at 6720.20 then following line was told today at 01:15 PM in Mid-session Outlook(09-04-2014);-
As consolidation patterns formations today and in previous session also therefore expectations are alive for rally continuation above 6776 in the coming sessions.
All trends are up but very Short Tern correction was due which was seen through last 6 Sessions sideways trading between 6651-6776 and this range forcefully broken out after almost 5 hours good consolidations therefore rally continuation is expected in the coming sessions.
Mid-session Outlook(09-04-2014)
As both selling and buying therefore sideways market(6663-6776 and 6651-6676) was told in previous 6 sessions and sustaining it beyond was told in all previous Outlooks and Nifty traded between this range in this week.
As consolidation patterns formations today and in previous session also therefore expectations are alive for rally continuation above 6776 in the coming sessions.
As consolidation patterns formations today and in previous session also therefore expectations are alive for rally continuation above 6776 in the coming sessions.
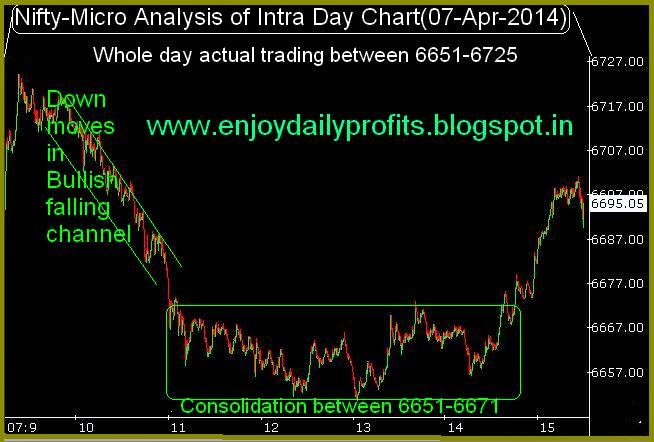
Technical Analysis and Market Outlook(09-04-2014)
Nifty-Intra Day Chart (07-Apr-2014):-
Technical Patterns and Formations in today intraday charts
1- Down moves in Bullish falling channel.
2- Consolidation between 6651-6671
3- Whole day actual trading between 6651-6725
Firstly down moves in Bullish falling channel and after that 3 hours consolidation with lower levels good supports also therefore up moves are expected in the coming sessions.
All trends are up,indicators are over bought and shown negative divergence as well therefore minimum Short Term Correction is due but complete follow up selling is must for any deeper correction
Lower levels consolidation and higher levels selling between 6663-6776 in previous week and good consolidation was seen 6651-6671 on 07-04-2014 therefore until Nifty will not sustain below 6651 after complete selling till then next decisive down moves will not be considered.
Although indicators are over bought and shown negative divergence also but Indian markets most Bullish and up moves may remain continued after correction completion in sideways moves or very Short Term correction. Expected that Nifty will trade and prepare for next trend between 6651-6776 and sustaining beyond this range will next trend confirmation.
 |
| Just click on chart for its enlarged view |
1- Down moves in Bullish falling channel.
2- Consolidation between 6651-6671
3- Whole day actual trading between 6651-6725
Conclusions from intra day chart analysis
Firstly down moves in Bullish falling channel and after that 3 hours consolidation with lower levels good supports also therefore up moves are expected in the coming sessions.
All trends are up,indicators are over bought and shown negative divergence as well therefore minimum Short Term Correction is due but complete follow up selling is must for any deeper correction
Lower levels consolidation and higher levels selling between 6663-6776 in previous week and good consolidation was seen 6651-6671 on 07-04-2014 therefore until Nifty will not sustain below 6651 after complete selling till then next decisive down moves will not be considered.
Although indicators are over bought and shown negative divergence also but Indian markets most Bullish and up moves may remain continued after correction completion in sideways moves or very Short Term correction. Expected that Nifty will trade and prepare for next trend between 6651-6776 and sustaining beyond this range will next trend confirmation.
Pre-closing Outlook(07-04-2014)
Following lines were told at 02:05 PM today in Mid-session Outlook:-
1- last 3 hours trading between 6651-6671 with consolidation patterns formations therefore first signal of very Short Term correction completion
2- Although expecting up moves but Valid break out of mentioned range should also be watched for mentioned very short term correction completion/continuation
Following line was told yesterday in Technical Analysis,Research & Weekly Outlook(Apr 07 to Apr 11,2014)
sustaining beyond 6663 should be firstly watched in next couple of sessions for next Short Term Trend confirmation.
As Nifty hovered around 6663 more than 3 hours when traded between 6651-6671 with consolidation patterns formations therefore moved up according to our expectations and now trading at 5997 therefore strong signal of today started up moves continuation in next trading session.
Mid-session Outlook(07-04-2014)
As Global markets weakness therefore down moves immediately after positive opening and last 3 hours trading between 6651-6671 with consolidation patterns formations therefore first signal of very Short Term correction completion which begun in previous week. Although expecting up moves but Valid break out of mentioned range should also be watched for mentioned very short term correction completion/continuation.
Technical Analysis,Research & Weekly Outlook(Apr 07 to Apr 11,2014)
Nifty-EOD Chart (04-Apr-2014):-
Technical Patterns and Formations in EOD charts
1- Bottom formation at 5118.85 on 28-08-2013 and Wave-1 beginning
2- Wave-1(6142.50 on 19-09-2013)
3- Wave-2(5700.95 on 01-10-2013)
4- Wave-i of Wave-3(6415.25 on 09-12-2013)
5- Wave-ii of Wave-3(5933.30 on 04-02-2014)
6- Wave-iii of Wave-3 continuation with new highest formation at 6776.60 on 03-04-2014
Conclusions from EOD chart analysis
All trends are up and Bullish market Wave-iii of Wave-3 continuation towards those higher levels which can not be easily imagined at this moment because many more those waves are still left which have already been updated in following topic on 30-03-2014:-
Nifty-Intra Day Chart (04-Apr-2014):-
Technical Patterns and Formations in today intraday charts
1- Down moves in Bullish falling channel.
2- Whole day actual trading between 6686-6728
As good selling during first 3 sessions of the week therefore consolidation was firstly required for decisive up moves and it was seen in last 2 sessions therefore emergence of rally continuation hopes also despite closing near the lowest of the day. Both good selling and some consolidation also seen in previous week and Weekly Candle is Doji(means indecision between bulls and bears) therefore signals of Short Term Trend turning sideways and sustaining beyond precious week trading range(6663-6776) will be immediate next trend confirmation and should be firstly watched in next week.
At present impulsive Wave-iii of Wave-3 continuation and minor signal of its completion in previous week because some selling was also seen in the beginning of previous week and Weekly Doji Candle(means indecision between bulls and bears). As lower levels some supports some consolidation was also seen in last 2 sessions therefore sustaining beyond 6663-6776 should be firstly watched in next week for immediate next trend confirmation.
It should be kept in mind that all trends are up and indicators and over bought and shown negative divergence as well therefore minimum Short Term Correction is due and follow up selling with sustaining below 6663 will be its confirmation.
As US markets closed .96% to 2.70% down last Friday and such weakness in Asian markets on next Monday morning will mean depressed sentiments and gap down opening can not be ruled out in Indian markets. In this situation sustaining beyond 6663 should be firstly watched in next couple of sessions for next Short Term Trend confirmation.
 |
| Just click on chart for its enlarged view |
1- Bottom formation at 5118.85 on 28-08-2013 and Wave-1 beginning
2- Wave-1(6142.50 on 19-09-2013)
3- Wave-2(5700.95 on 01-10-2013)
4- Wave-i of Wave-3(6415.25 on 09-12-2013)
5- Wave-ii of Wave-3(5933.30 on 04-02-2014)
6- Wave-iii of Wave-3 continuation with new highest formation at 6776.60 on 03-04-2014
Conclusions from EOD chart analysis
All trends are up and Bullish market Wave-iii of Wave-3 continuation towards those higher levels which can not be easily imagined at this moment because many more those waves are still left which have already been updated in following topic on 30-03-2014:-
Nifty-Intra Day Chart (04-Apr-2014):-
 |
| Just click on chart for its enlarged view |
1- Down moves in Bullish falling channel.
2- Whole day actual trading between 6686-6728
Conclusions from intra day chart analysis
Conclusions (After Putting All Studies Together)
At present impulsive Wave-iii of Wave-3 continuation and minor signal of its completion in previous week because some selling was also seen in the beginning of previous week and Weekly Doji Candle(means indecision between bulls and bears). As lower levels some supports some consolidation was also seen in last 2 sessions therefore sustaining beyond 6663-6776 should be firstly watched in next week for immediate next trend confirmation.
It should be kept in mind that all trends are up and indicators and over bought and shown negative divergence as well therefore minimum Short Term Correction is due and follow up selling with sustaining below 6663 will be its confirmation.
As US markets closed .96% to 2.70% down last Friday and such weakness in Asian markets on next Monday morning will mean depressed sentiments and gap down opening can not be ruled out in Indian markets. In this situation sustaining beyond 6663 should be firstly watched in next couple of sessions for next Short Term Trend confirmation.
Mid-session Outlook-2(04-04-2014)
New intraday lowest formation after sharp down at 2:00 Pm today but until Nifty will not sustain below 6675 till then decisive down moves will not be considered because consolidation patterns formations seen today.
Mid-session Outlook(04-04-2014)
As good selling in first 3 sessions of the week therefore very short term correction and consolidation was due and it has been seen yesterday and today. Consolidation patterns formation seen yesterday and today therefore emergence of rally continuation hopes in next week.
Technical Analysis and Market Outlook(04-04-2014)
Nifty-Intra Day Chart (03-Apr-2014):-
Technical Patterns and Formations in today intraday charts
1- Down moves in Bullish Falling Channel
2- Fast up in last half hour.
3- Whole day actual trading between 6697-6776
As continuous higher levels selling in last 3 sessions therefore very short term correction possibility was required and it was seen through most time down moves in Bullish Falling Channel which is consolidation pattern. Good selling in last 3 sessions therefore some down moves can not be ruled out during consolidation process but expected that Nifty will trade and prepare for next trend between last 3 sessions range(6675-6764) and valid break out of this range will be next Short Term Trend confirmation.
 |
| Just click on chart for its enlarged view |
1- Down moves in Bullish Falling Channel
2- Fast up in last half hour.
3- Whole day actual trading between 6697-6776
Conclusions from intra day chart analysis
As continuous higher levels selling in last 3 sessions therefore very short term correction possibility was required and it was seen through most time down moves in Bullish Falling Channel which is consolidation pattern. Good selling in last 3 sessions therefore some down moves can not be ruled out during consolidation process but expected that Nifty will trade and prepare for next trend between last 3 sessions range(6675-6764) and valid break out of this range will be next Short Term Trend confirmation.
Subscribe to:
Posts (Atom)